- Blog
- 04.17.2023
- Dev Dialogues, Data Productivity Cloud 101
An assessment of the UK's Electric Vehicle infrastructure
With low running costs and less impact on the environment, it's a great time to consider switching to an electric vehicle (EV).
In the motor industry, most R&D investment is going on EVs. Sales are consistently rising around the world. Every country has a growing network of public charge stations. Just like gas stations, you will need these during a long journey!
But what happens when there are not enough charge stations to go round? Like many people, I saw reports of long queues in 2022. That turned out to be misleading, but nevertheless I wanted to investigate more deeply by looking at the data behind the headlines.
Here in the UK, plenty of raw data is available under the Open Data Initiative. So are we headed for queues, or the fast lane? I used the Matillion Data Productivity Cloud to investigate the facts.
This article shows how I did it, and what I discovered.
Data Source Summary
The data for this article comes from the UK's Department for Transport (DFT) as part of the Open Data initiative. It contains public sector information licensed under the Open Government Licence v3.0.
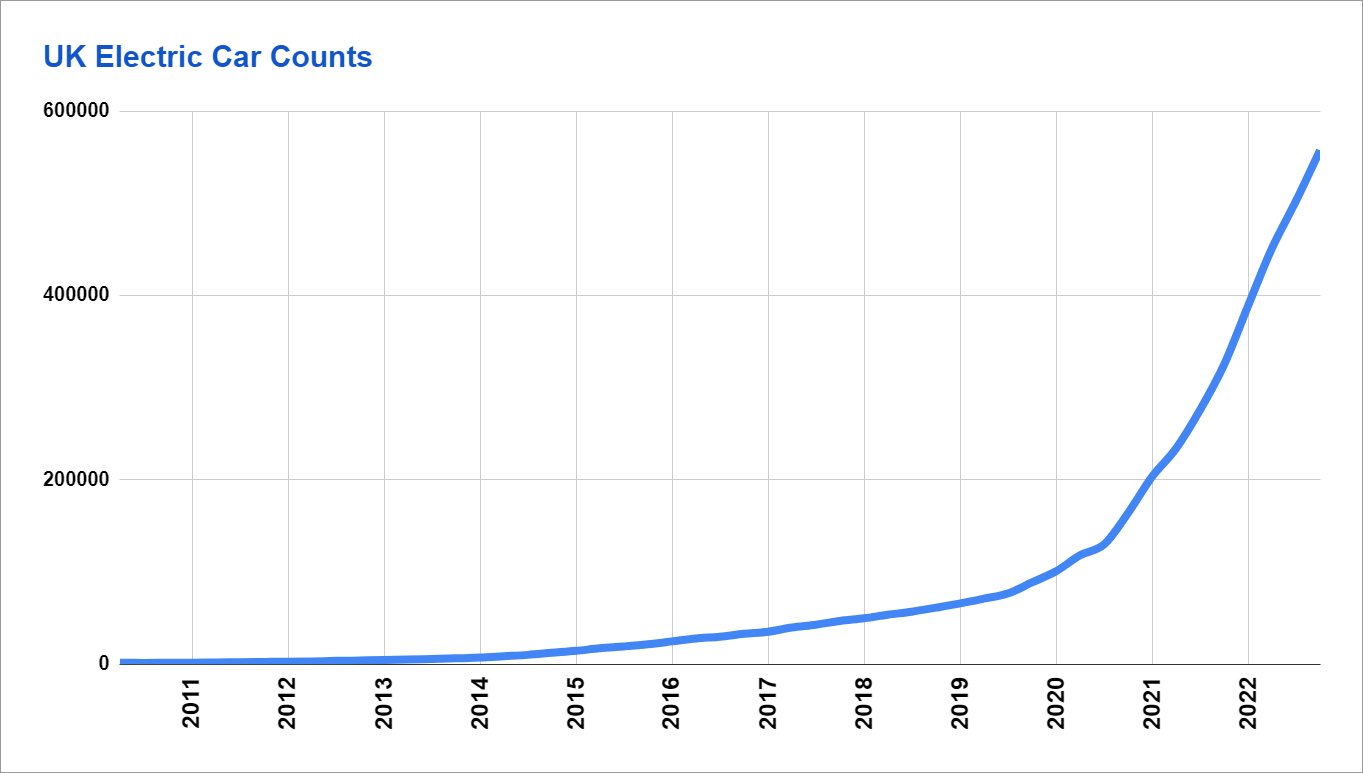
The first dataset is the number of licensed electric vehicles on the roads. To download it from the website, follow Plug-in vehicles > Licensed vehicles > VEH0141: Licensed plug-in vehicles. After processing, the vehicle counts look like this:
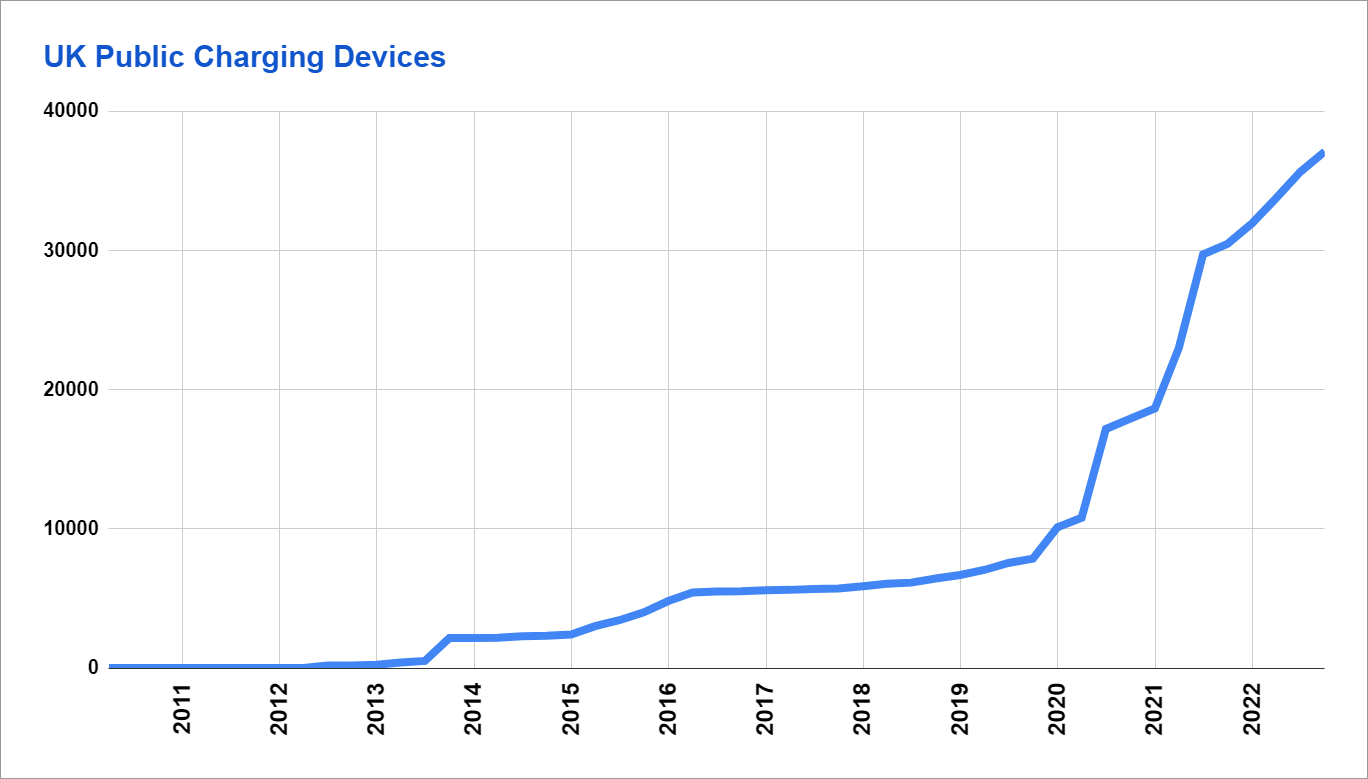
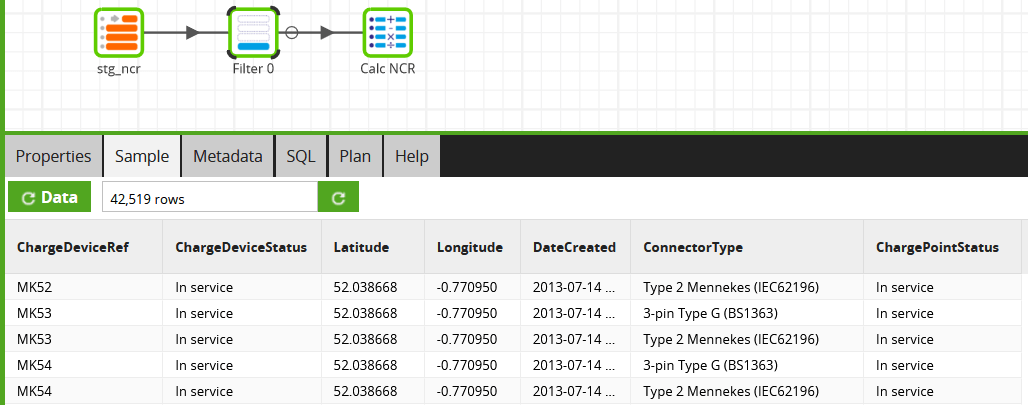
The second dataset contains information on public electric vehicle charge points. It comes from the UK's National Chargepoint Registry (NCR). The number of charge points has also been increasing year on year. After processing, the data looks like this:
To explore the relationship between these two datasets, they need to be joined by date. To do this, they need to be brought together (colocated) into a cloud data warehouse. Starting with the Licensed Electric Vehicles data.
Licensed Electric Vehicles in the UK
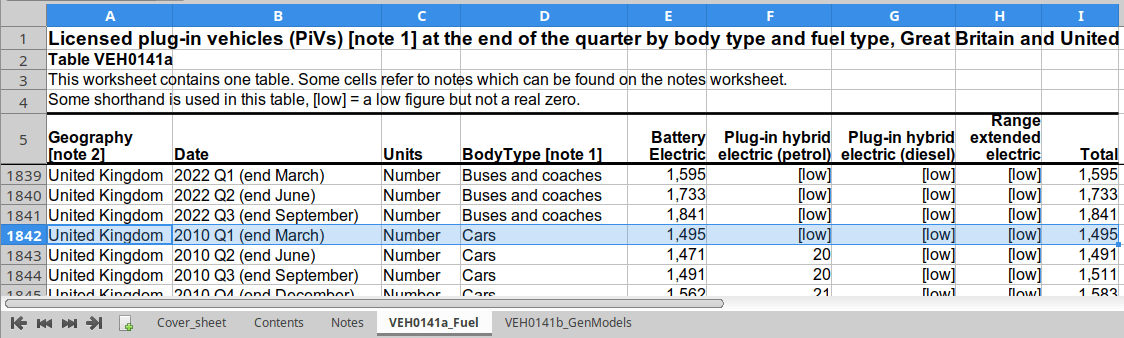
The DFT provides Licensed Electric Vehicle data in OpenDocument Spreadsheet (ODS) format. The totals for cars in the UK are in the VEH0141a_Fuel sheet, highlighted in this screenshot:
With only one line per quarter since 2010, it's a tiny dataset. It is easy to copy and paste into a CSV file. But it's usually better to automate where possible, so at the end of this article there is an appendix showing how to convert ODS to CSV using Python.
For convenience, you can use this link to download the converted data.
As you can see, the data is rather messy in its original format:
- Strange column names
- Date strings like "2010 Q1 (end March)" that are human readable, but difficult to interpret electronically
- Highly formatted numbers, where the string "[low]" means an unknown, small value
- The useful cell range is some way down the sheet
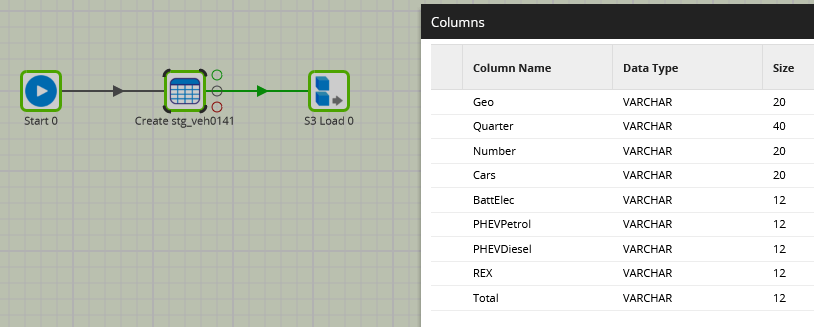
In other words, the source data has high quality, but low consumability. It is best to start by dealing with the data loading problem on its own. When loading into a cloud data warehouse I recommend setting all the columns to strings in a Create Table component:
After loading, it's time to deal with the consumability problems using a data transformation Calculator component.
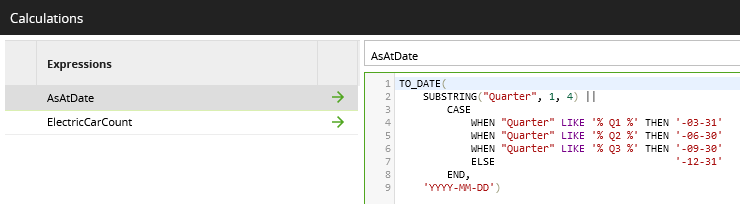
First the strings that look like dates:
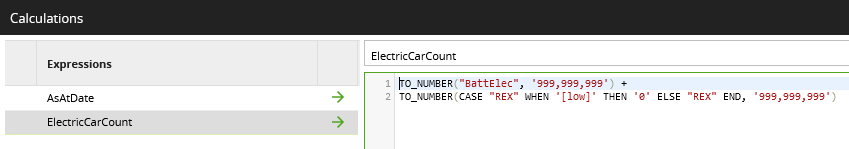
Now the strings that look like numbers. I'm going to ignore plug-in hybrids, and only include pure battery electric and range extended vehicles:
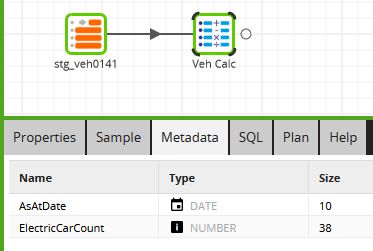
Transformation work like this has the biggest impact on starting to make the data usable and valuable. Now there is a real date, and a real number.
UK National Chargepoint Registry
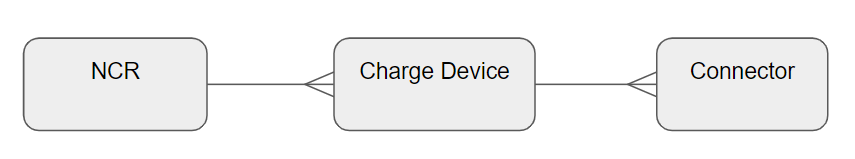
Chargepoint data is available from the UK government data portal, as a JSON API. It is a single, large document containing multiple levels of nesting. At the time of writing there were 26,557 charge devices nationwide, most with multiple physical connectors.
You can build your own Matillion ETL data connector to flatten the nesting. Alternatively, for convenience, you can download a pre-built connector from the Matillion Exchange.

To use the pre-built connector in Matillion ETL, start with another Create Table component, followed by an API Query:
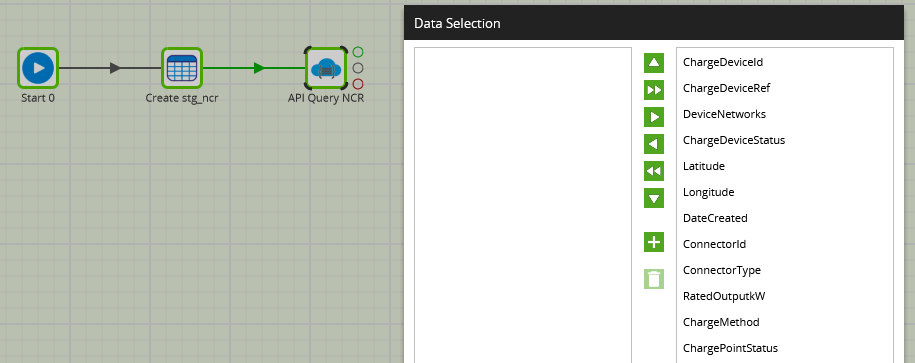
Charge devices that are not in service are no use to drivers! Adding a Filter component is the best way to exclude them. A data sample shows 42,519 connectors in service at the time of writing.
Insight from the correlated data
Now both data sets have been loaded into a cloud data warehouse, they can be correlated by date.
For every instant where there is an EV count, we need the number of charge device connectors that first came online on or before that date. This requires an interesting type of non-equality SQL join, known as a theta join. In fact it's quite easy to express in a Join component:
"OnlineDate" <= "AsAtDate"
You can find another practical example of a theta join in this article on numeric densification techniques.
Finding the ratio between the two measures needs an aggregation by date and another calculator component. The full transformation job looks like this:
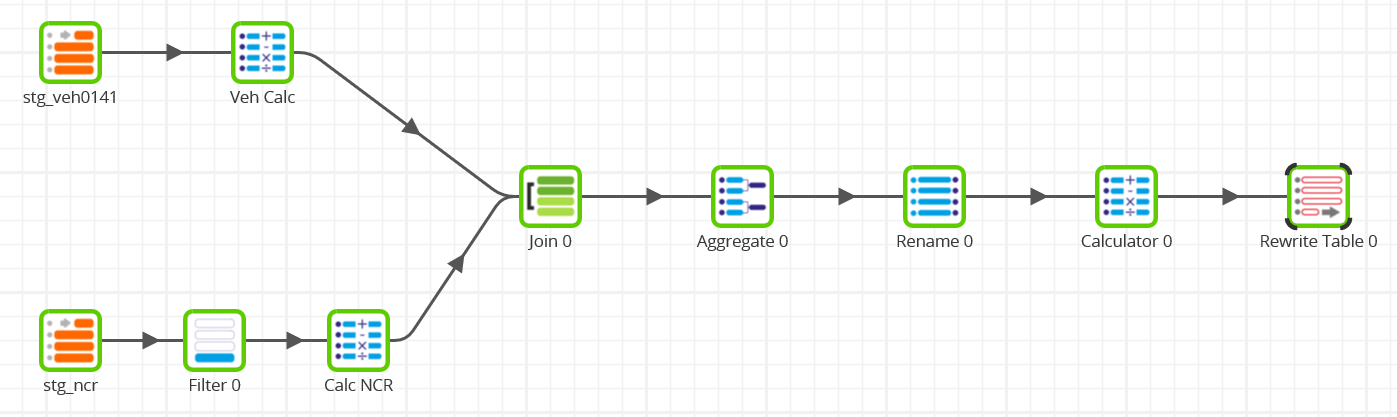
So, what does the data say?
As you saw in the charts at the start, the number of EV's on the road and the number of charge points have both been rising. Especially sharply since around 2020.
But the ratio between the two has been steadily falling since a high point in 2013. In fact, during the last ten years, the ratio in the UK has decreased by a factor of five:
- From a peak of 0.34 public charge points per electric vehicle, in September 2013
- To an almost ten-year low of 0.07, in September 2022
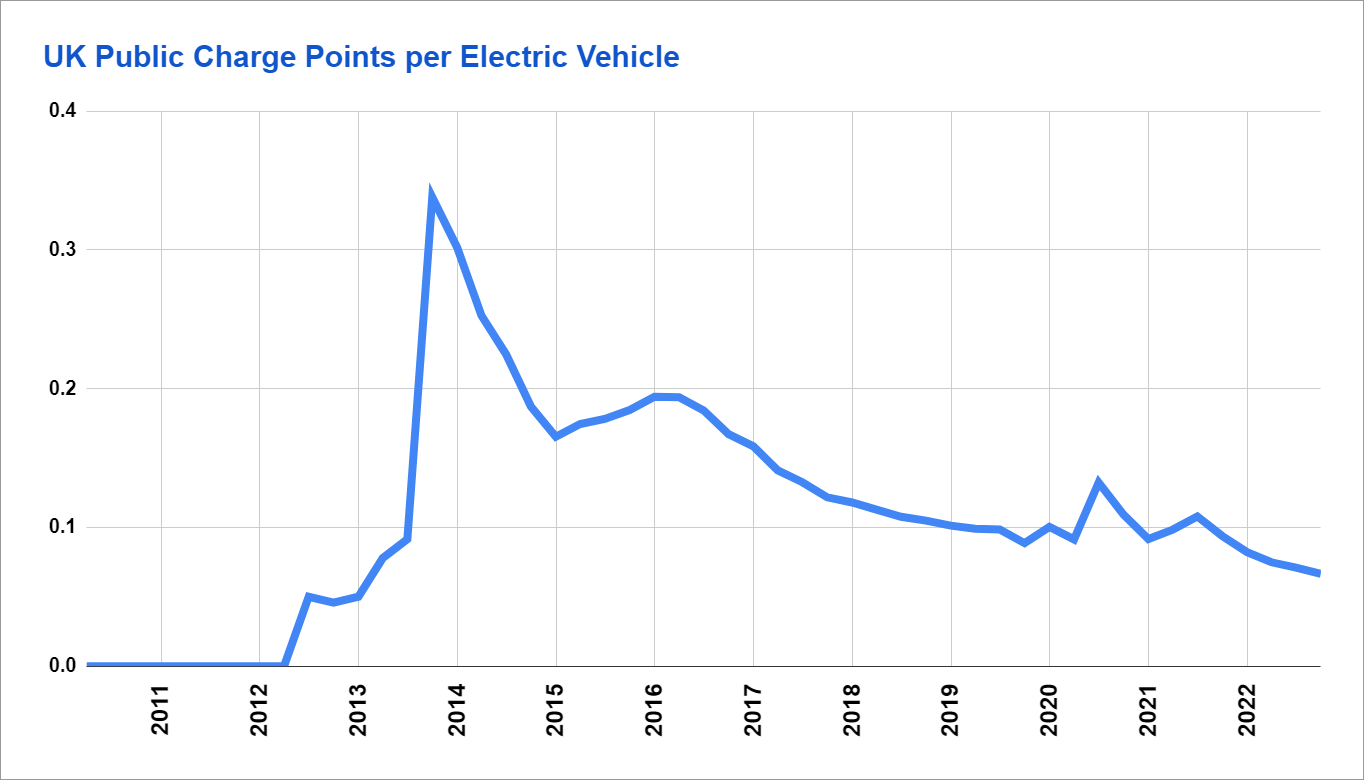
The long term trend is negative. My advice is to charge fully before leaving home!
Appendix - Convert ODS to CSV using Python
Here's how to automate reading the licensed electric vehicle data from the OpenDocument Spreadsheet veh0141.ods.
Start by installing the pyexcel Python packages:
python3 -m pip install pyexcel
python3 -m pip install pyexcel-ods
python3 -m pip install pyexcel-io
Then in a Python Script:
import pyexcel as p
datad = p.get_book_dict(file_name="veh0141.ods")
def rowselector(l):
if(l[0] == "United Kingdom"):
if(l[2] == "Number"):
if(l[3] == "Cars"):
return True
return False
ukevcars = list(filter(rowselector, datad["VEH0141a_Fuel"]))
p.isave_as(array=ukevcars, dest_file_name="ukevcars.tsv", dest_delimiter='\t')
Next Steps
All the source data is open, so go ahead and try this yourself as part of a POC or trial!
For more information about how Matillion ETL and Snowflake work together in a modern enterprise data stack, download our ebook, Optimizing Snowflake; A Real-World Guide.
To learn our tips for working within AWS and Amazon Redshift environments, download our ebook, Optimizing Amazon Redshift: A Real World Guide.
To understand more about the Databricks lakehouse architecture and the benefits of using Matillion ETL for Delta Lake on Databricks, download our ebook, Guide to the Lakehouse.
Andreu Pintado
Featured Resources
Enhancing the Data Productivity Cloud via User Feedback
Find a data solution that allows you the option of low-code or high-code, extreme amounts of flexibility, tailored for cloud ...
BlogHow Matillion Addresses Data Virtualization
This blog is in direct response to the following quote from ...
NewsVMware and AWS Alumnus Appointed Matillion Chief Revenue Officer
Data integration firm adds cloud veteran Eric Benson to drive ...
Share: