- Blog
- 04.26.2023
- Data Productivity Cloud 101
How to optimize your customer data for business analytics
Matillion Data Builder Series
This is the third and final installment of our Data Builder Series on Customer Data Platforms. Our goal with the Data Builder Series is to help you explore the opportunities and overcome the challenges of data use and equip you with the knowledge and insights you need to maximize data productivity. We highly recommend that you read the first two blogs in this series, focusing on data management models and data transformation. And look out for upcoming topics and blogs in our Data Builder series to help you explore the world of data productivity and unlock the potential of your data.
All transformed, and no place to go
In the previous blog in this series, we discussed how to protect and transform your customer data so that Personally Identifiable Information (PII) is properly protected and that you have a unified profile for each customer that is accurate, consistent, and complete.
The next step is to get your customer data analytics-ready so that your business users, who are not experts in the manipulation of data, can get the most value from it. In essence, you have to change the format of the data in your cloud data platform, making the data easier to understand and interact with.
This is where schemas come into play. A database schema defines how data is organized within a database. A transformation schema is used to prepare data for analysis. In contrast, an analytics schema is used to explore the data while analyzing it, making it easier to garner more meaningful information and creating a more efficient reporting and analysis process.
Ultimately, getting the data into an analytics-ready state ensures that the data is properly organized and structured to support analytics functions and business intelligence and analytics tools. These include commercial software, such as Tablaeu, ThoughtSpot, and Sigma, as well as homegrown portals and solutions.  Figure1. Raw data becomes standardized, and its schema gets more simplified as it is transformed to become analytics-ready
You need both types of schemas as part of the data integration process within your modern Customer Data Platform (CDP) because the transformation schema is where the datasets are built to publish into an analytics schema.
More and more organizations are moving to cloud-native data integration platforms like the Matillion Data Productivity Cloud because legacy solutions with on-premises processing could not handle the scale of transformation processes needed to get the increasing volumes of data into an analytics-ready state.
As a result, some BI tools started to add functionality where they would perform the necessary modifications on the data before reporting on it. This not only slowed down the reporting function but also led to potential gaps in business knowledge because the business users did not have the expertise to ensure that the BI tools were accessing and digesting all the necessary data.
Getting your customer data analytics-ready
The key to getting your customer data analytics-ready at scale is simplifying the structure of the data. You need to model the data, understand how it is structured and stored, and put together rules to ensure that the incoming data is stored in a manner that complies with that model, making it much easier to comprehend the information in your customer data platform. This, in turn, enables your developers to group the data more effectively into various layers when designing data pipelines within the cloud data platform where your customer data is stored.
Using customer demographics data as an example, let’s examine how this works in practice. To create a successful data model, it is important to understand the different types of data, the relationships between various entities, and the attributes of each entity. For customer demographics, the data will typically come from Salesforce, your sales ordering system, and a few additional sources, such as customer survey data. Each source will contain some types of customer demographic data needed for the analytics layer to respond to a business query. Once you understand how your data is modeled, you can then begin to do additional manipulations on the data to facilitate analysis. 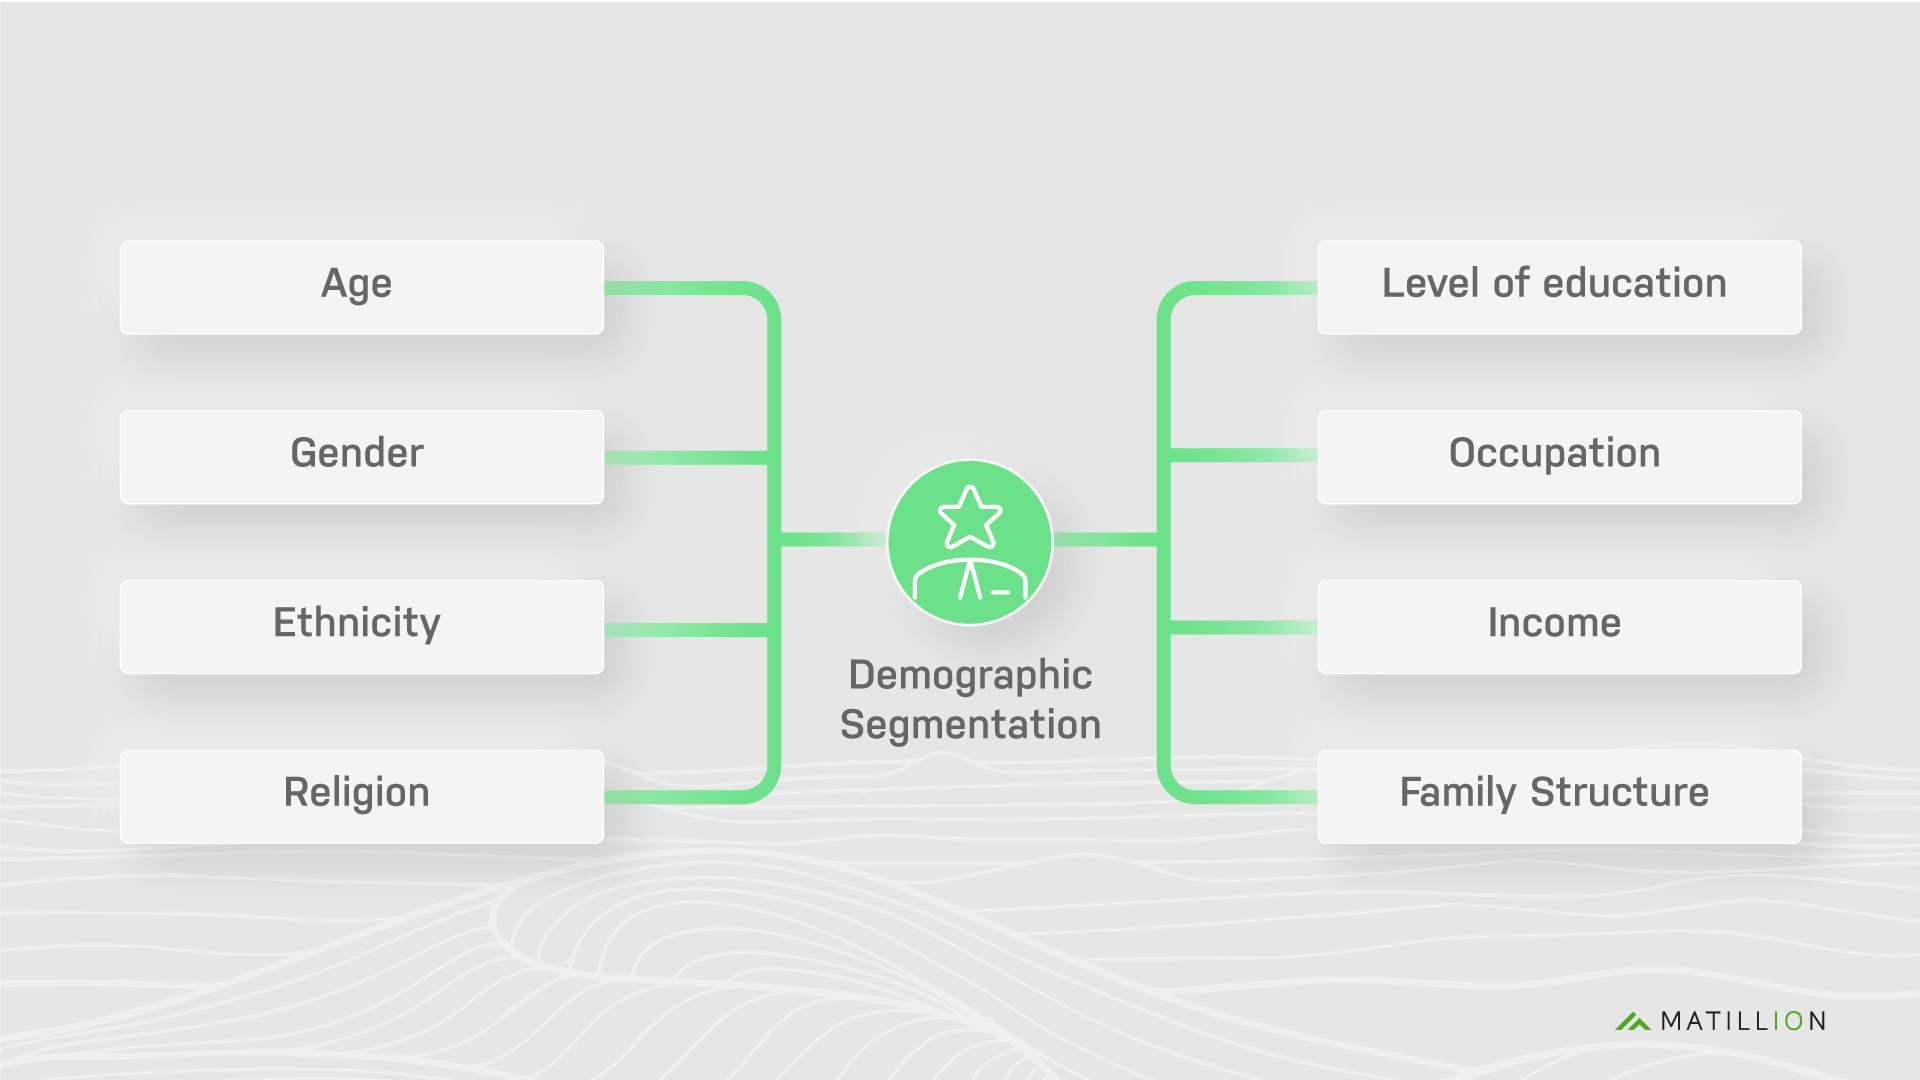 Figure 2. Typical segmentation of customer demographics data.
Filtering – Only analyze the data that matters
You can start modeling your customer demographics data with a few simple rules to segment the raw data coming in, based on when the data was loaded or updated. You can then use this segmentation to ensure that only the new or updated customer demographics data is fed into your transformation schema, where the data is normalized to your corporate standards. The standardized customer demographics data can then be filtered to ensure that relevant and up-to-date data is sent to your business users and digested by your BI/analytics tools.
The figure below shows how this can be easily accomplished with Matillion using the Filter and Calculate components. 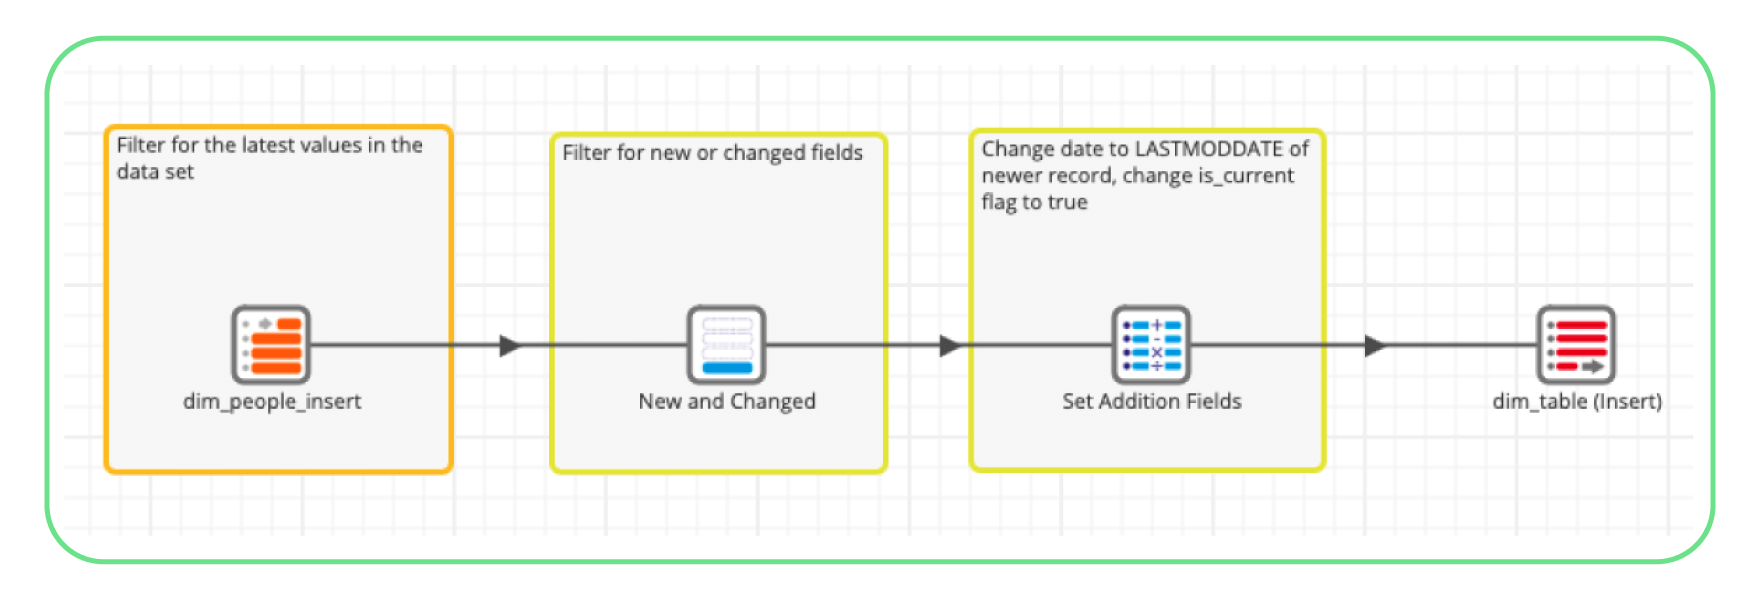 Figure 3. Filtering for the latest values and changes in a source dataset to ensure data is up to date with Matillion.
One of the key advantages of Matillion is that our calculator component makes any database function, including user-defined functions, available in Matillion for all developers to leverage. In addition, because Matillion extracts and loads the data into a cloud data platform before transformations take place, Matillion leverages the database functions, as well as the processing power, of your cloud data platform to process data faster at scale.
Aggregation – Group data to simplify analysis
Aggregating data is the key to a productive data warehouse. This is all about storing data at the correct granular level so it meets our business rules. In practice, this entails grouping data together into conformed data sets to simplify our data structure.
Here, we have a typical enterprise with account information from one source and customer emails in an unstructured format from a different source. We use the Calculate component to figure out the web domain for our accounts. At the same time, we flatten the unstructured email data and use another Calculate component to figure out the email domains of customers. We then join the two datasets to create a new customer accounts data set that includes both account and email information. 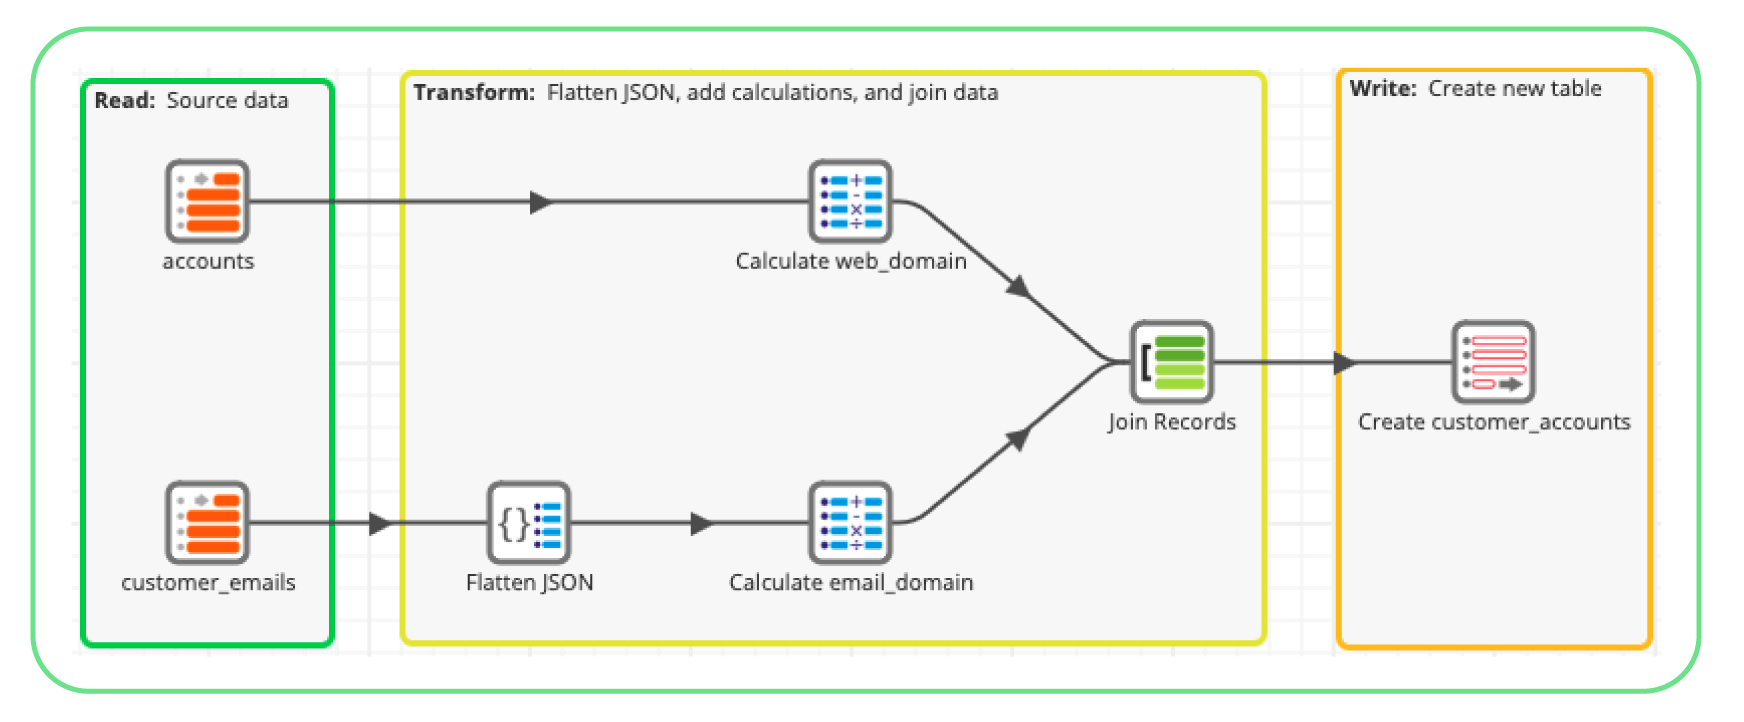 Figure 4. Joining account and email information.
Functions – Do the analysis legwork upfront
A data integration platform like Matillion, with its extensive integration into the database functionality of your cloud data platform, can help you dig deeper into your transformed data. In turn, this helps you gain a greater understanding of your data and develop more refined analytics-ready data sets that can be used both for reporting and for further analysis by your BI/analytics solutions.
Let’s see how Matillion’s Calculate component, which enables you to create functions to perform on your data, can help you accomplish this and create a table of customer profits segmented by account.
Step 1. We define ‘profit’ in our ‘Calculate’ function. 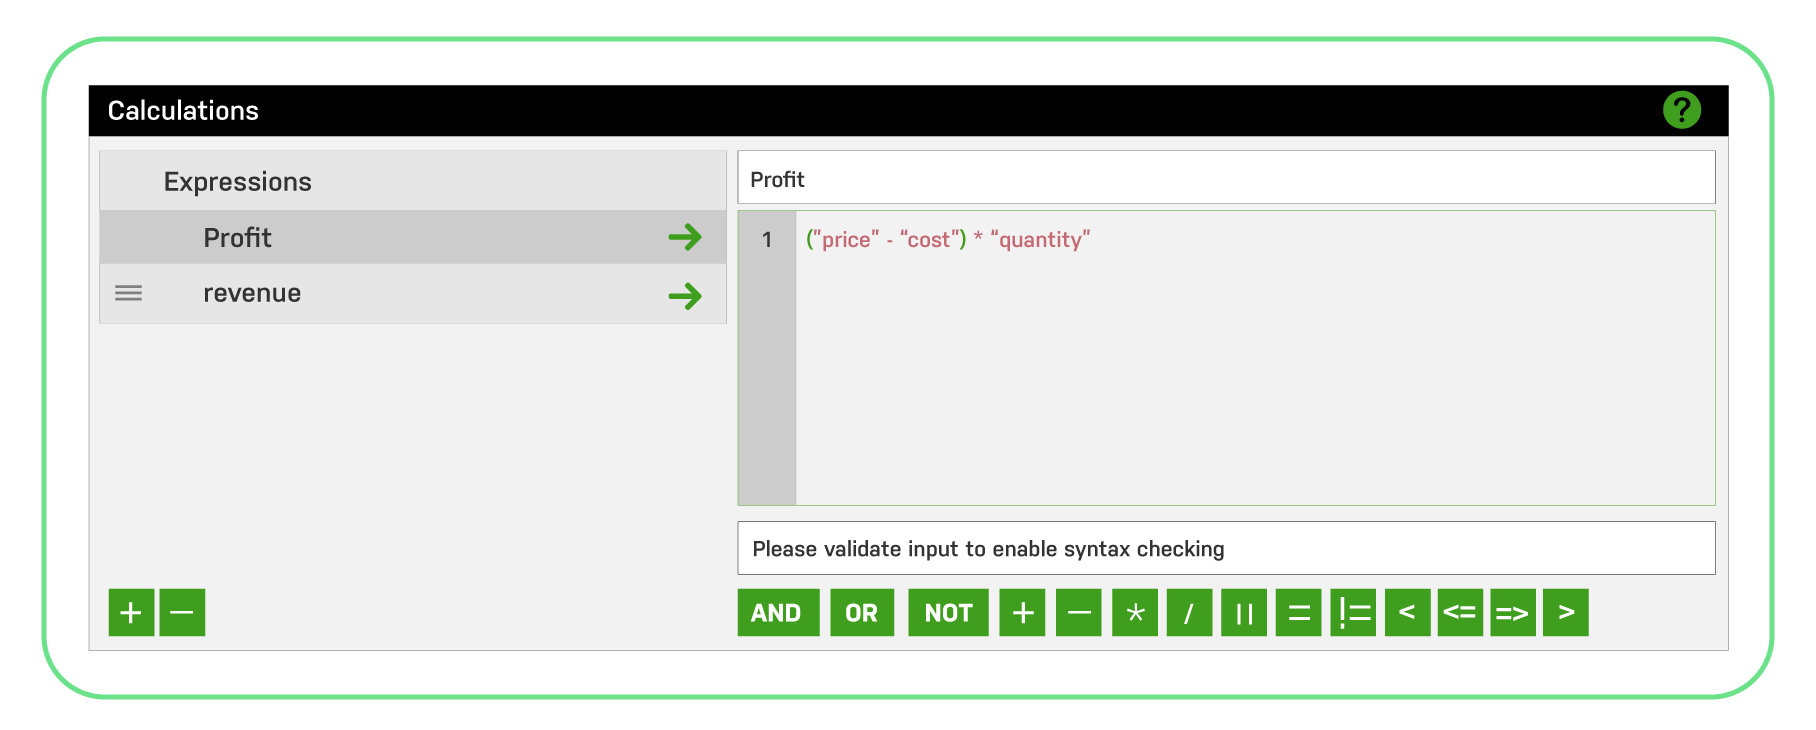 Step 2. We define ‘revenue’ in our ‘Calculate’ function.
 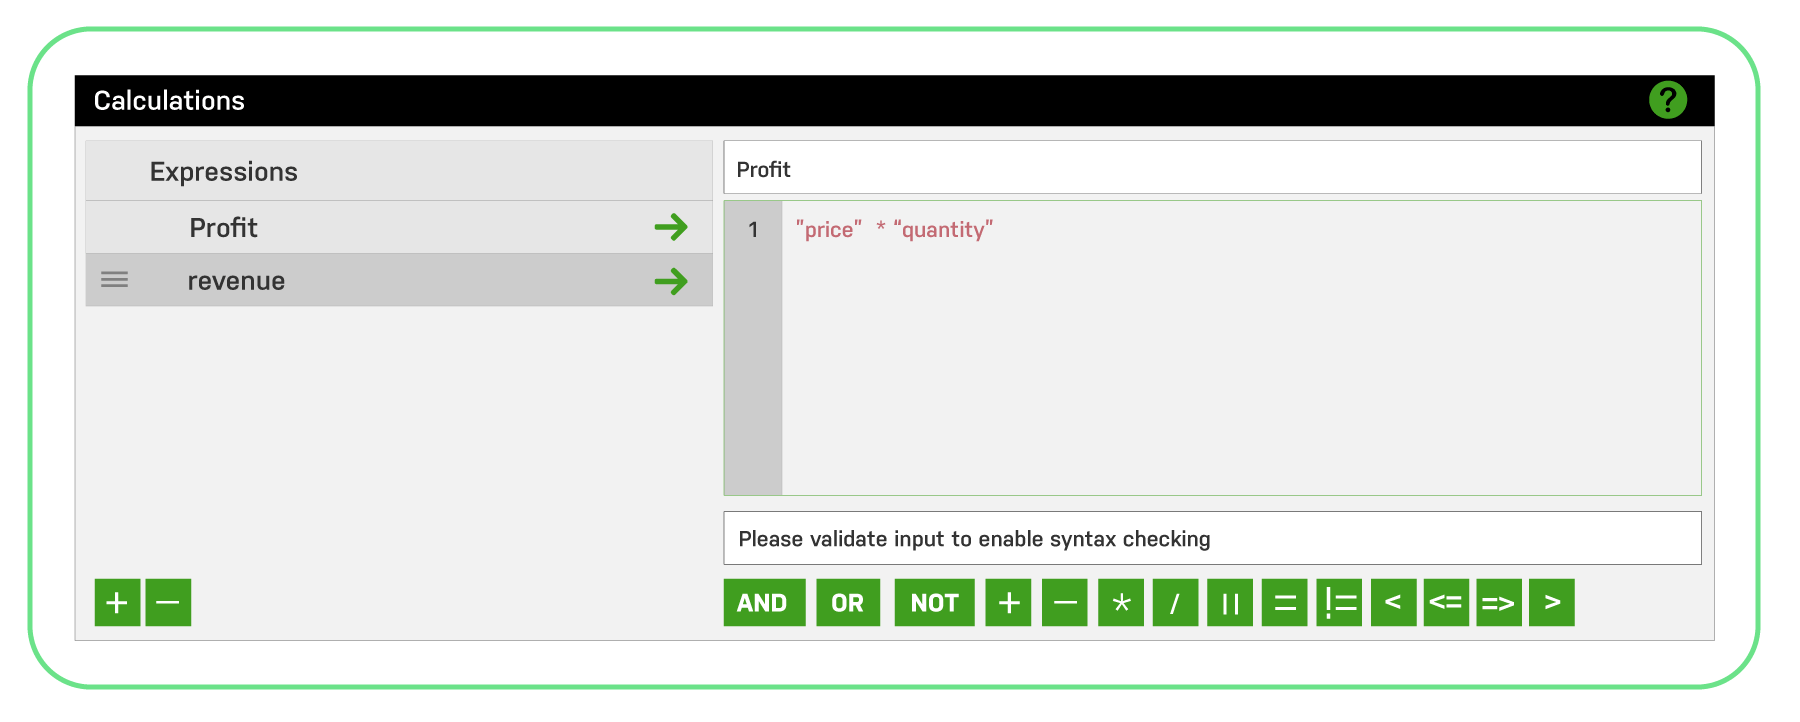 Step 3. We create a fast layer for the business team to ingest the data by joining our Customer Accounts dataset with sales transaction data from our Points of Sale. We then use our Calculate and Aggregate components to create a new dataset that shows profits by account.
 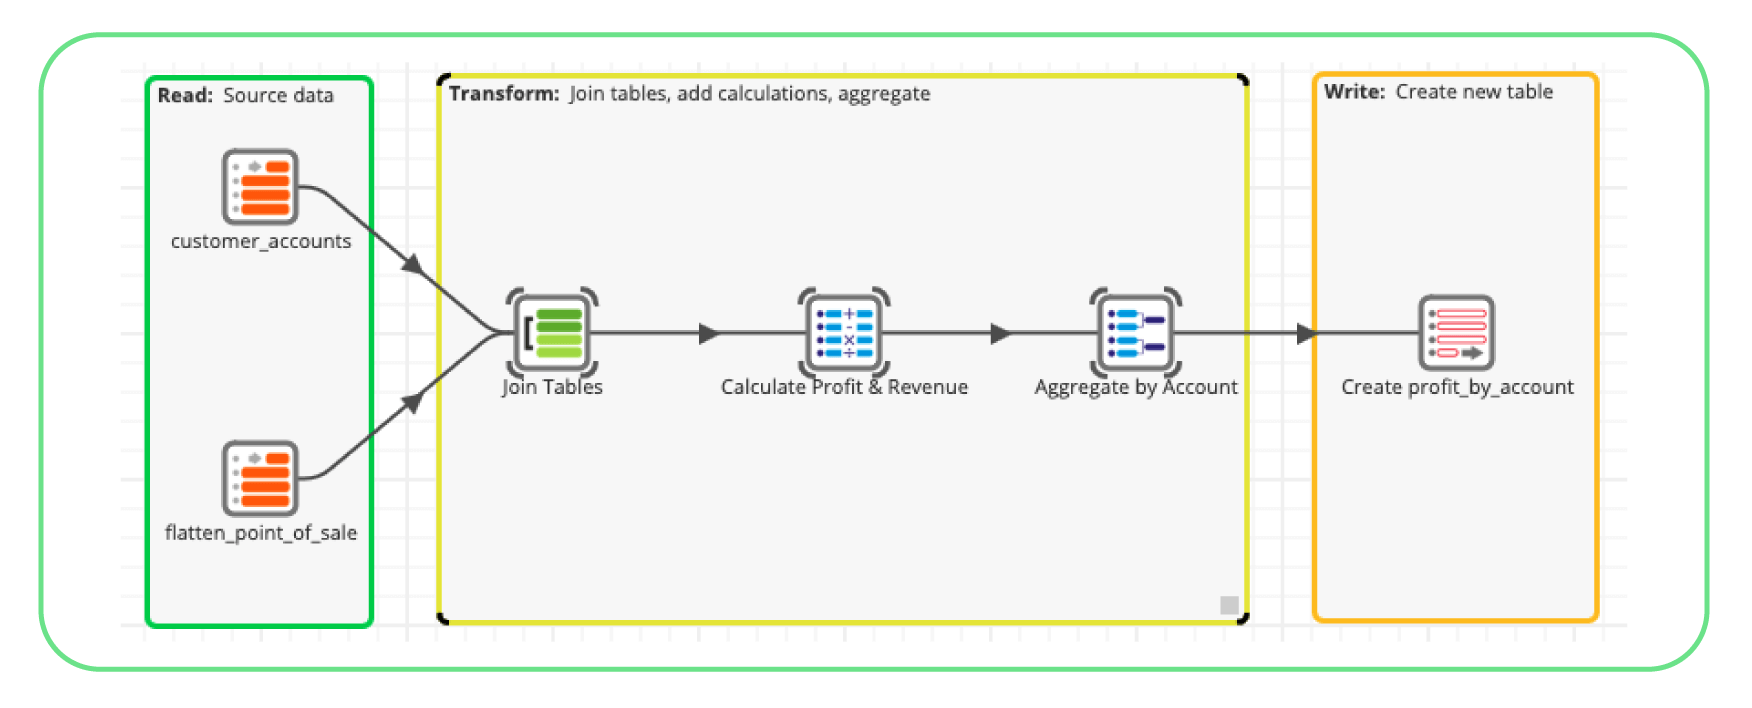 Matillion can process data at scale, leveraging your cloud data platform's massively parallel processing power. This enables you to slice and dice your customer data in ways that make sense, while, at the same time, maximizing reporting refresh rates and making your end-state analytics environment more predictable and efficient.
Synchronize your data back to business applications
Do you want your enriched, analytics, and business-ready customer data to be used more? Get it into the hands of more people? Ensure that you are targeting the right customers with the right offers? One surefire way to accomplish these results is to get the enriched customer data back to the business applications your sales and marketing teams are familiar with.
This ability to sync enriched data back to your business applications is called reverse ETL. Simply put, reverse ETL is taking data loaded into a cloud data platform, transforming it to meet certain business standards and analytics requirements, and then pushing it back into the source systems for all users to take advantage of in their operational systems.
Matillion provides a number of options for managing tables via reverse ETL. You can simply create a new table on the fly if there is no corresponding table in the source business applications. You just have to make sure that the new table fits within the table standards of the intended destination – i.e. the original source business application like Salesforce. However, in many instances, you will want to sync your data back to a table that already exists in the destination. In that case, Matillion makes it easy to configure your Matillion table to match before outputting the data back.
An example of how this works is illustrated by combining customer demographics data from Salesforce with additional data from another source – for example, communication preference information gathered from a survey – into a new table. We then create a transformation job where we match the structure of our new table to the customer demographics table we want to load the data back into in Salesforce. We then run our new data pipeline and output (i.e. load) the combined and transformed data back to Salesforce. 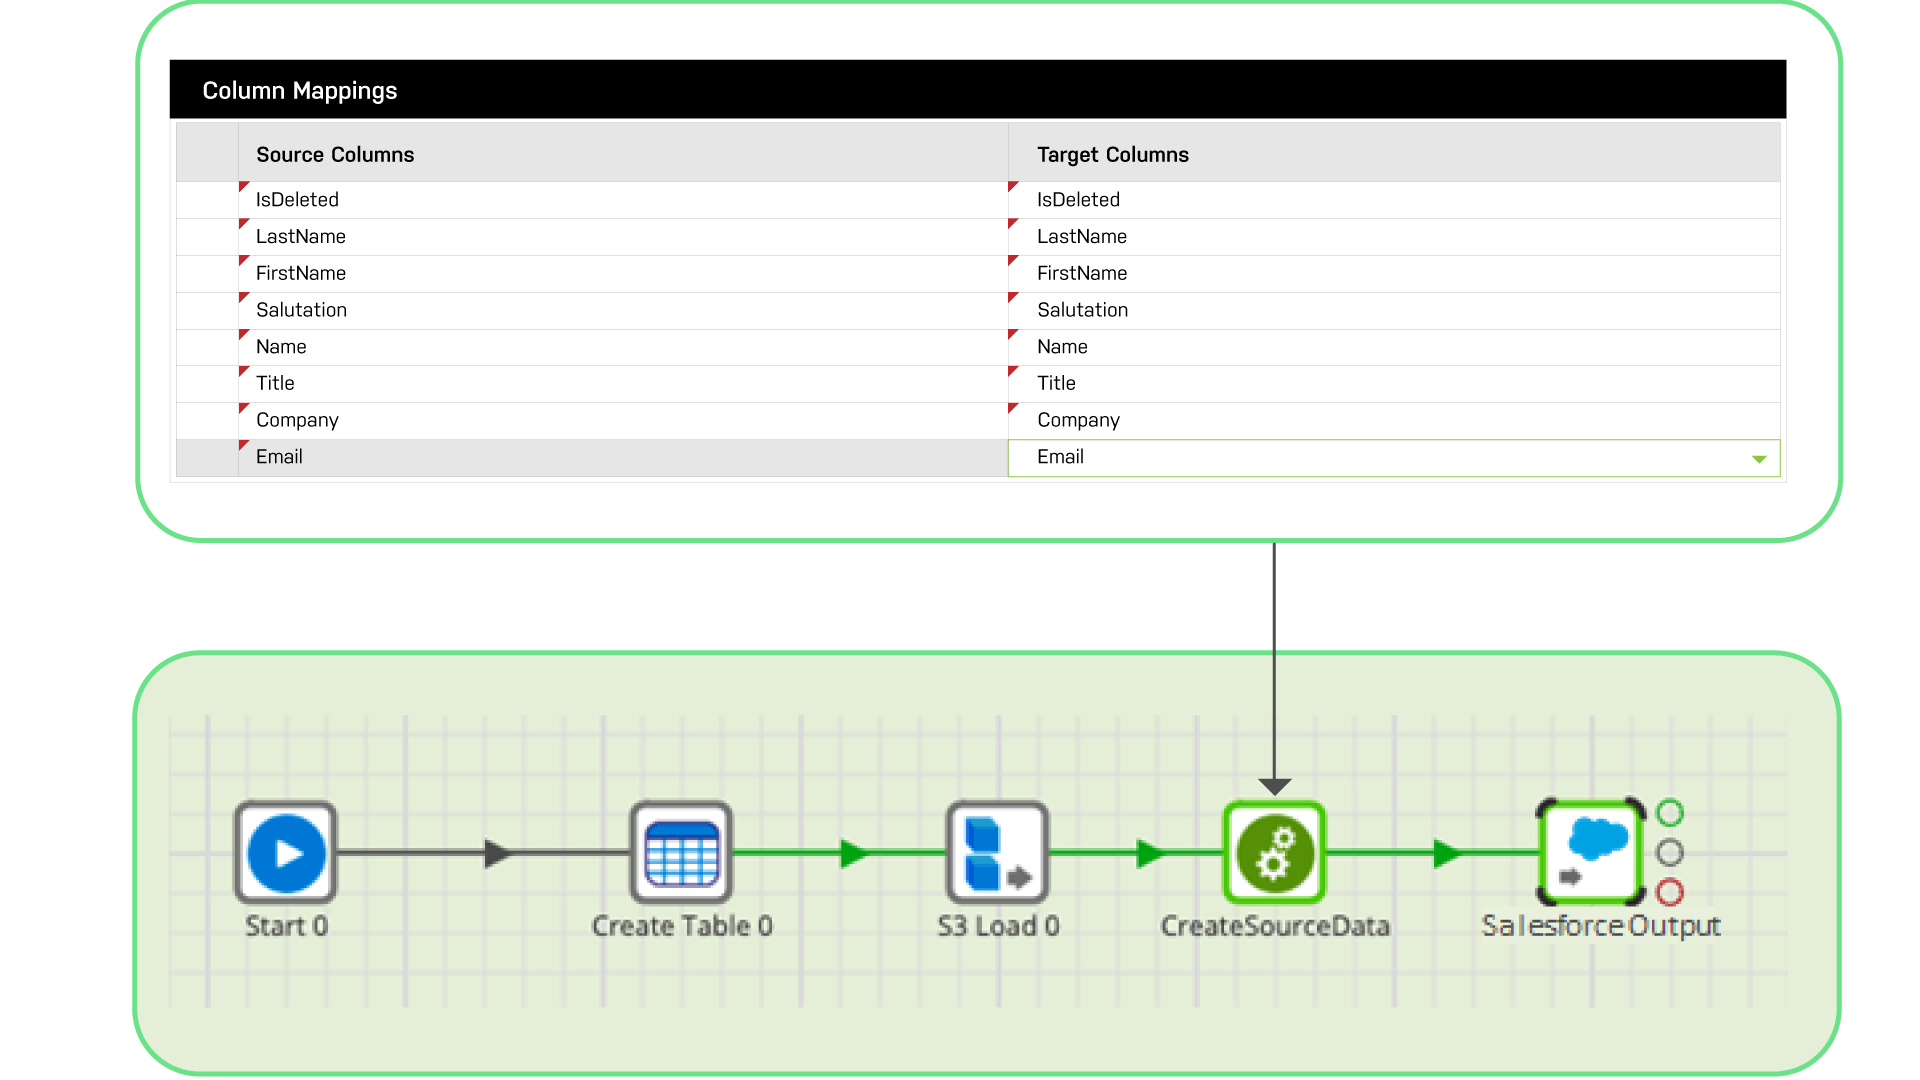 Figure 5. Synchronizing data back to Salesforce. Synchronizing and loading data back to the source business applications can be done at any point within a data pipeline and ensures that your business users have access to the most complete and up-to-date information in the applications they are used to accessing on a regular basis.
Real-life examples of what you can do with your customer data
A data integration platform like Matillion can make it much easier to build a modern customer data platform in the cloud and maximize the value of your customer data. We wanted to share some recent examples of the amazing results achieved by our customers with their customer data.
Daikin Comfort built a 360-degree customer view in the cloud
Daikin Comfort is the world’s number one indoor comfort solutions provider, manufacturing heating and cooling systems. As part of a Customer 360 project, they relied on Matillion to integrate and standardize customer data across the entire organization. Within a few months, they were able to integrate data from 5 separate systems and develop more than 120 data pipelines. Now, they are able to understand their customers better, automatically generating and updating customer lifetime value reports with real-time information from multiple systems.
“Matillion helped us combine data from five separate systems – ERP, Dealer/ Distributor, CRM, Warranty, and Rebate Program – to achieve a single source of truth for our customer data.”
Mark Pearson
Director, Data Management & Strategy at Daikin Comfort
Red’s Savoy Pizza transitions to a data-driven approach and thrives during the Covid-19 pandemic
Red Savoy Pizza, a pizza franchise in the midwest, relied on Matillion to integrate data from multiple franchisee transaction systems to get a near real-time understanding of their customer’s purchasing decisions. This enabled them to better adjust to changing customer behavior and helped them increase customer loyalty transactions by 50%. They thrived during the pandemic while many other restaurants struggled.
“We were able to watch the customer behavior and help predict and prepare the franchises for the changes.”
Reed Daniels
President and CEO at Red’s Savoy Pizza Franchise Corporation
Engage3 builds a robust and reliable data platform
Engage3 uses curated pricing data, alongside data science and predictive analytics models, to provide the industry’s largest competitive pricing database, helping retailers and brands track and optimize their pricing. Engage 3 relied on Matillion to speed up and optimize its own data and analytics processes, enabling them to provide more timely and accurate insights to its own customers.
“Scale and loading performance are no longer an issue for us. Overall the solution has helped bring about a 95% reduction in time required to make new insights available downstream.”
Matt Belo
Senior Data Engineer at Engage3
What’s next in the Data Builder Series
We hope you enjoyed our first Data Builder Series blogs on Customer Data Platforms. Watch out for additional content – videos, how-to guides, etc. – coming soon. Our next Data Builder topic will be on frictionless ETL. We'll provide you with our thoughts and guidance on how to achieve a modern data integration platform that is everyone-ready, usable by more than just data engineers, stack-ready, manages your entire modern data stack, and future-ready, built for your needs today and for tomorrow.
Andreu Pintado
Featured Resources
How Your Data Teams Can Do More With Marketing Analytics
Improve your marketing analytics with Matillion Data Productivity Cloud that enables businesses to centralize and integrate ...
BlogThe Importance of Data Classification in Cloud Security
Data classification enables the targeted protection and management of sensitive information. Personally Identifiable ...
BlogBuilding a Type 2 Slowly Changing Dimension in Matillion's Data Productivity Cloud
A Slowly Changing Dimension (SCD) is a dimension that stores and manages both current and historical data over time in a data ...
Share: