- Blog
- 09.05.2021
- Data Fundamentals, Dev Dialogues
Is it Going to Rain Tomorrow? Forecast Accuracy in a Unified Data Science and BI Environment
What does it take to forecast the weather, and how far ahead can we trust a forecast? In this article, we use Matillion ETL, and Delta Lake on Databricks, to try to put a number on that.

The Met Office is the UK government weather department. Met Office DataPoint is their online service which provides forecast and actual weather information. Let’s take a look at a situation in which information from Met Office DataPoint is used by both a BI analyst team and a data science team.
The analyst team intends to integrate the weather forecasts with various other data sources to predict sales of ice cream. The value of the insights they obtain depends strongly on the accuracy of the weather predictions. This is where the data scientists step in. They want to check the prediction accuracy, and in particular answer two questions:
- Are the weather predictions actually better than guesswork?
- How far into the future can we rely upon the predictions?
To answer these questions, I will use Matillion ETL to load, transform and integrate the raw data into a contingency table in Delta Lake. Once that is complete I will run a chi-square test in Databricks to perform the accuracy checks.
Data acquisition
The first step on the journey is to make the data available widely, quickly, and painlessly. As you’d expect, copying the data from place to place and making it available to Databricks is not difficult. The full Matillion Orchestration Job looks like this:
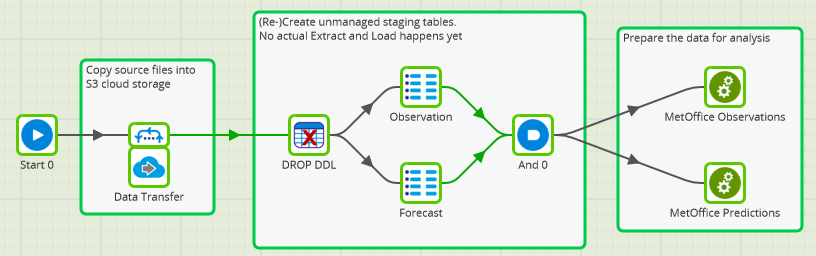
If the two Databricks objects happen to exist already, the Drop DDL removes them. Afterward, the Observation and Forecast components create unmanaged ingestion tables: one for the forecast data and one for the observations.
Unmanaged tables are a simple way to share the data among teams without having to make copies. In addition, the tables use an inferred schema. This helps protect against schema drift in case the Met Office decides to change the format.
At this point, users across the business can be empowered to start taking advantage of the data. The forecasts and observations are available as Spark SQL tables, which are easy to use as the basis for data integration.
In the next two sections I will focus on how the data science team uses those Spark SQL tables to work on the data for their specific needs. This is done in two Transformation Jobs, which are invoked at the end of the screenshot above: MetOffice Observations and MetOffice Predictions.
Making a guess from observations
What’s the weather going to be like tomorrow? Perhaps a reasonable guess is that the same time tomorrow, it will be pretty similar to how it is right now.
So is there any point spending money on making predictions when you could just look out the window and make a guess? Let’s find out!
I have weather observations going back about one year, which is plenty to look back and check the weather at any given moment compared to the same hour of the previous day. Only one data set is needed in the MetOffice Observations Transformation Job:
The unmanaged table of observations that was created earlier. You can see it on the far left hand side of the screenshot below.
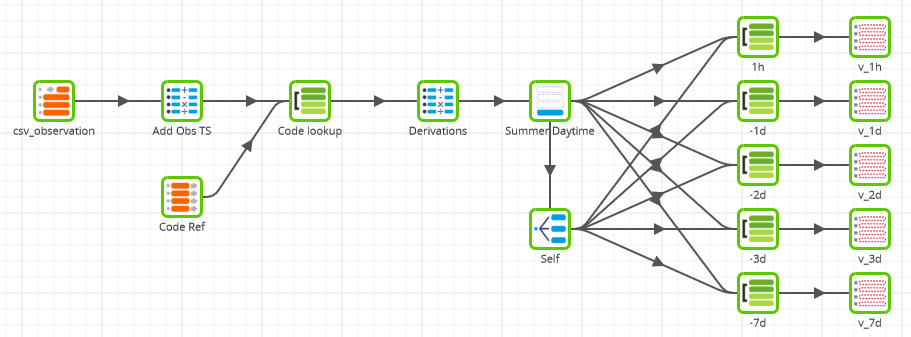
For the statistical test, the contingency table needs to show the actual weather against the weather 24 hours from then . In a Transformation Job, the way to do that is using a self join. It is done with the help of the Replicate component named “Self”.
In fact, I intend to repeat this test five times to establish if there is a pattern. What was the weather like compared to: 1 hour ago, 1 day ago, 2 days ago, 3 days ago and 7 days ago. Those are the five sets of Join and View components on the right of the screenshot.
Other transformations include
- Calculator components to convert strings into Spark SQL dates and timestamps
- A Filter to only look at daylight hours during the months of summer, when the ice cream is for sale
Data enrichment with a code lookup
Actual and Forecast measurements both contain a code indicating the “weather type.” The code on its own is just a number between 0 and 30. A code lookup is needed to find the type of weather associated with each value. In Matillion ETL, I used a Fixed Flow component like this:
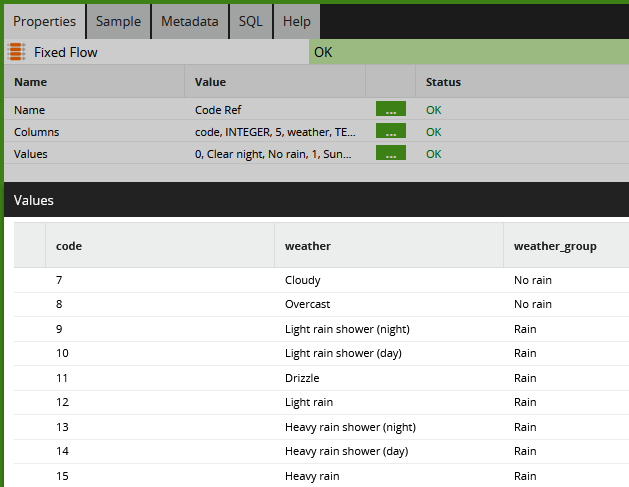
Being a British institution, the Met Office makes a distinction between “Light rain shower”, “Drizzle”, “Light rain”, “Heavy rain shower” and “Heavy rain” 🙂
That’s far too much detail. First it seems rather harsh to say that a prediction of “Drizzle” is wrong if the actual weather was “Light rain.” Second, this data is going to be used to predict ice cream sales, and ice cream won’t sell if there’s any rain, regardless of how much.
So for the above reasons, I enhanced the Met Office reference codes with the third “weather group” column that you can see above. This new column will form the basis of the accuracy tests.
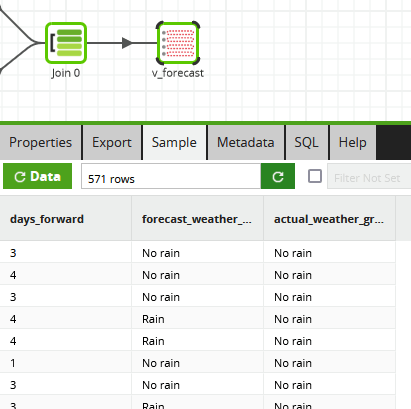
It is always useful to check the data before moving to the next step. Below is a sample from the 7-day view named v_7d, which compares weather groups against the observation 168 hours in the past.
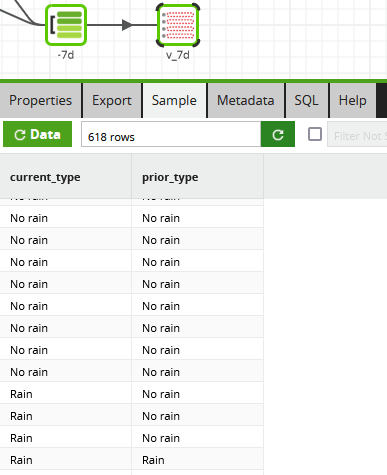
The sample tab confirms that data has been transformed into exactly the structure needed for input to statistical analysis.
Running a chi-square test
Matillion ETL for Delta Lake on Databricks runs as part of a unified Data Science and BI environment. So it’s straightforward to perform the statistical analysis in an R notebook on the same data that Matillion has been using.
In the below screenshot a few lines of R code convert the input records into a contingency table and run the chi-square test. It’s the exact same data we were looking at in Matillion ETL in the previous section. The 618 rows in the Matillion sample is the sum of the 536 + 37 + 40 + 5 cells in the matrix in R.
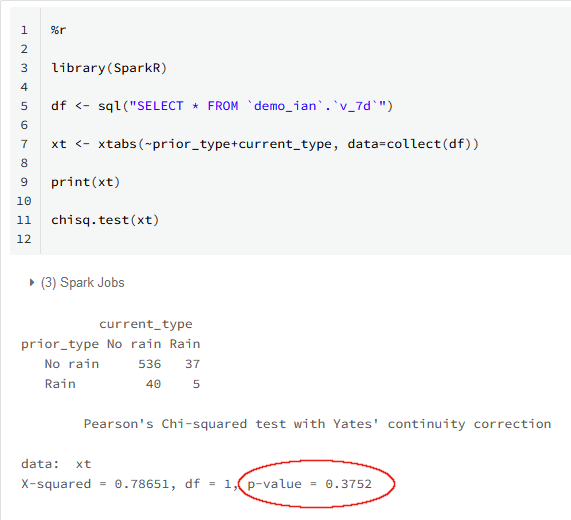
The p-value is highlighted. This is the probability that any relationship between the weather 168 hours ago and right now is coincidental. The value 0.3752 is far outside the threshold of statistical significance, which would be around 0.05. So I have to conclude that there’s really no relationship between the two.
Well, expecting some relationship seven days apart was always rather optimistic. How about the closer ranges? Here is a table of the results from all five tests:
| Range | p-value | Conclusion |
|---|---|---|
| 7 days | 0.3752 | No better than guesswork |
| 3 days | 0.1952 | No better than guesswork |
| 2 days | 0.05112 | Surprisingly strong relationship. Taking interest... |
| 1 day | 0.1745 | But again, no better than guesswork |
| 1 hour | 4.195e-12 | Strong relationship |
The result of the 1 hour test is not surprising. If it’s not raining right now, it almost certainly will not be raining in one hour’s time. At least it confirms that the test works, although it does not really help the business
Overall, the p-value jumps around a little, but it’s clear there’s no predictive value in this method, even just one day ahead.
Enough guesswork. Let’s see how the real Met Office predictions fare!
MetOffice Predictions
This transformation job integrates two data sets. The observations and the predictions both appear as Table Input components on the far left hand side of the screenshot below.
Integrating these two historical data sets gives me the advantage of hindsight. The Join component looks at every prediction and finds the corresponding actual observation that was eventually made some time later.
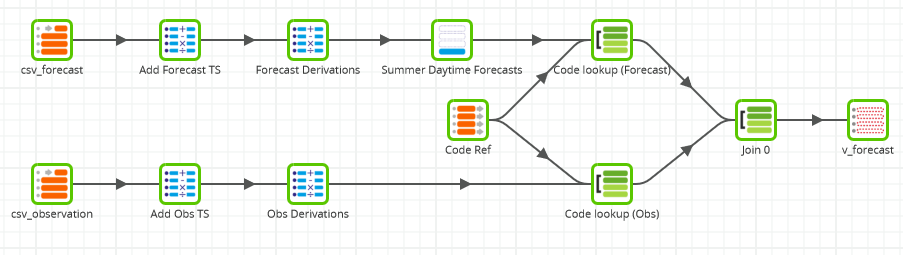
All the calculations and filters are the same as in the previous job. The same Code Lookup is performed for data enrichment against both the observations and the predictions.
Rather than creating multiple views, this time I took a slightly different approach and added a “number of days ahead” column into one single output view.
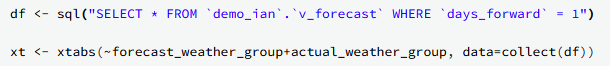
To check the forecast, the Databricks notebook is almost identical, except it needs a filter on the days_foward column to check one prediction range at a time.
Were the Met Office forecasts better than a guess? Here are all the results:
| Range | p-value- | Conclusion |
|---|---|---|
| 1 day | 0.00207 | Strongly predictive |
| 2 days | 0.0004254 | Strongly predictive |
| 3 days | 0.004894 | Strongly predictive |
| 4 days | 0.4627 | This is a stretch too far, it's no better than guesswork |
In summary, it seems that this type of forecast is very accurate up to three days ahead. There’s no value looking further ahead than that, and indeed the Met Office DataPoint forecasts don’t go much beyond 100 hours or so into the future.
Recap
Aside from checking the accuracy of weather forecasts, this has been a short, worked example of how it looks and feels to use a unified Data Science and BI environment. (You can learn more about how Matillion ETL helps data teams work more closely together in the lakehouse in our ebook Guide to the Lakehouse.)
I used Matillion ETL for Delta Lake on Databricks to quickly load data into Spark SQL and make it available to multiple teams. After that, I prepared the data for statistical analysis using the compute power and scalability of Delta Lake, leveraged through Matillion’s simple graphical user interface. Finally I used a specialized statistical function in the R language from a Databricks notebook.
The two worlds are integrated, so no copies of the data were required. Furthermore, I was only using database views, so the data was not actually materialized anywhere: there were literally no physical copies to maintain.
Try it out yourself
You can find the two datafiles I used here. The Matillion and R source code is available here, and you can import them into your own cloud and Matillion ETL infrastructure.
To see how Matillion ETL integrates with your existing data ecosystem, request a demo.

Ian Funnell
Data Alchemist
Ian Funnell, Data Alchemist at Matillion, curates The Data Geek weekly newsletter and manages the Matillion Exchange.
Featured Resources
Mastering Git at Matillion. Exploring Common Branching Strategies
Git-Flow is a robust branching model designed to streamline the development workflow. This strategy revolves around two main ...
BlogMatillions Diversity, Equity, Inclusion and Belonging (DEIB) Work and Why It's Important
At Matillion, our primary focus is on cultivating a company ...
BlogThe Importance of Reverse ETL in the Enterprise
Reverse ETL involves moving data from data warehouses or lakes back to operational systems. This blog explains why it is ...
Share: