- Blog
- 03.23.2022
- Data Fundamentals, Dev Dialogues
Create Data-Driven Organizations with a Good Data Culture
This is the third article in a five part series on data integration. The series covers the following foundational topics:
- Data-Oriented Programming needs Data Integration – App and format proliferation, the challenge of a process oriented mindset, data colocation vs integration, data integration methodologies and boundaries
- Creating Highly Consumable Quality Data with Data Integration – Data quality, centralization and interdependence, semi-structured data considerations
- Create Data Driven Organizations with a Good Data Culture (this article) – ETL and data science teams, interfacing with the wider business
- Data Change Management – Iterate Rapidly and Track Lineage – Change as an opportunity, low-code/no-code, data lineage
- Data Has State – Data Functions and Design Patterns – data processing functional design patterns, and the development lifecycle

Getting value from data in any modern enterprise first requires getting hold of the data. This is known as data extraction, and it mainly involves dealing with format proliferation. After that, data transformation and integration steps are needed. Transformation makes the data most consumable. Integration deals with application proliferation and makes the data comparable across business domains.
Those things are basic prerequisites for moving into position to uncover valuable, joined-up information and insights. The next step is to ensure that the alignment exists within the business to enable a data- and analytic-driven culture. In TOGAF terms, this is addressing the business architecture phase of the architecture development method.
I will use the phrase “data team” quite broadly in this article. The intention is to cover all the roles involved with the development and maintenance of a data platform. At the very least, this includes ETL design and development, reporting, analytics, data science, and feature engineering.
Modern data teams use a data warehouse application and a cloud data warehouse (CDW) to perform data transformation and integration. The data team is often centralized so it can serve the entire business. Alternatively, the roles may be distributed out as data mesh teams, paid for by individual departments.
In either case, there are three places where mutual understanding and alignment are important:
- From source to data team
- The context switch from process orientation to data orientation
- Internal within the data team
- Efficient delivery of interdependent or centralized models
- Alignment among the ETL, reporting, analytics and data science teams
- From data team to end-users
- Delivering the information and insights that make the biggest difference to all the stakeholders and the business, in the most consumable way
All three bring unique opportunities for misunderstandings and misalignment with respect to using data 🙂 In the next three sections I will talk about each in more detail.
Source to data team
In order to be successful, the data team has to understand the data from all the source applications the business is using. This is vital for every aspect of their work. So the starting point for a good data culture is a mutual understanding that, by default:
- Applications create data with concern only for that single application
- Members of the data team are interested only in the data, and have no concern for the process that created it
This is the essence of the context switch from process orientation to data orientation. For internal applications – created or maintained within one company – the data team needs to be able to find the business rules between the application’s data and presentation layers. The data team also needs to know the underlying data structures, and what values to expect.
There are three potential barriers to a good data culture:
- Lack of understanding that the context switch is a real problem. In fact it is quite natural for this to happen. As I described in this earlier data integration article, in the process-oriented mindset of application development, there is no difference between data colocation and data integration.
- Understanding the context switch, but without agreement on whose problem it is. In reality it needs engagement from both the application team and the data team. It requires alignment.
- Failing to prioritize the exchange of information over this context switch.
Let me dig into the second and third points some more with the help of some real context switch examples. Below is a table that compares the process-oriented theory with the reality that a data-oriented investigation usually soon discovers.
| Process-oriented theory | Data-oriented reality |
| Geocode transactions using the customer's zipcode | Many zipcodes are missing |
| Uniquely identify transactions from the combination of ID and date | the combination is not always unique |
| Find the commission rate from the contract that was active when the transaction was recorded. | Not all transactions are associated with an active contract |
| Aggregate transactions by product category | The many different source systems all differ in what they mean by "product category" |
| Sum and average the transaction line item dollar amounts | Some of the line item dollar amounts are not numeric values |
| Use the chart of accounts to allocate transactions to the correct level | The COA is corrupt or ambiguous, and there is more than one possible way to navigate it |
| Look up the campaign for every transaction | Difference source systems use different campaign names to mean the same thing |
Most modern application development and maintenance uses an agile methodology. The definition of done is that the application is able to perform a useful vertical slice of functionality. There may be a cursory mention of some inscrutable “data,” but in general, data architecture is not a top-level citizen.
The result is that changes to applications go live before anyone has seen real data. As I described in this earlier data integration article, it means the data teams have to resort to guesswork. They can not fully participate in the same application development methodology. The consequences are:
- Data problems become operational problems, and it is too late to tackle them as part of the original agile iteration. When all of the data-oriented realities in the table above occur, they cause data processing exceptions. The integration software can not handle them. Data quality becomes a convenient scapegoat. This is the root cause of the myth that source data quality is poor.
- There are delays or gaps in the available insights: Ironically, often including a lack of insight into the performance of the application itself.
In other words, a definition of done that does not include any consideration of the data is not fully compatible with a good data-driven culture. Even if the original work was performed waterfall style, it is rare to find a data model in a specification document. It’s even more rare to find an accurate one 🙂
One last point on this subject regarding semi-structured data: Committing to the exchange of undocumented semi-structured data is equivalent to not making any commitment.
Semi-structured data is entirely self-describing, and it can be changed infinitely within its markup rules.
In reality, internal applications are in the minority. Most of the sources that data teams work with are third-party, cloud-hosted SaaS systems.
The bad news with SaaS systems is that it is almost always impossible to get direct access to the underlying data. Consequently, SaaS systems do not make any effort to promote understanding of their data model. And sometimes, they actively make external data integration difficult.
The good news with SaaS systems is that they do almost always offer some level of automated data access. Often, and most ideally, it is through a REST API. It is usually in the interests of the platform to provide some data integration capabilities. So the APIs are usually well documented. Even though the exchange formats are usually semi-structured, there is often helpful information on the actual structures and values to expect.
It is clear that part of a healthy data culture involves the ability to interact with APIs. One of the fundamental challenges to getting value from data involves the mechanics of copying it from place to place. However, doing that can – ironically – make the challenge worse. Having multiple copies of the same thing creates a time lag, and introduces an opportunity for the copies to become mismatched.
Exchanging data and metadata using governed APIs and virtualization can help reduce the problem, which I will talk more about in a future article. There is also more on the subject of circular data architectures in this article on multiple tier data architectures. Meanwhile, let’s look more closely at data culture within the data team.
Internal data culture within the data team
I have been referring generally to the set of roles that use and present data as the “data team.” There are many different roles, and they all try – in their own unique ways – to generate valuable, joined up intelligence from multiple sources.
- Reporting and analytics teams integrate data to make it optimal for consumption by humans via reports and dashboards, and the ETL work is called data transformation
- Data science teams integrate data to make it optimal for consumption by algorithms and visualizations, and the ETL work is called feature engineering
Could some of that transformed data also be used as input to an algorithm? Could that feature engineering work save the transformation team some time?
Data Transformation vs Feature Engineering
Data transformation and feature engineering are different names for very similar work. As part of a data culture to achieve optimally scalable analytics, it’s important to keep things consistent while avoiding needless duplication of effort.
Here is a simplistic example:
The reporting and analytics teams do some ETL to aggregate and summarize beverage sales from multiple systems. They publish the totals by product.
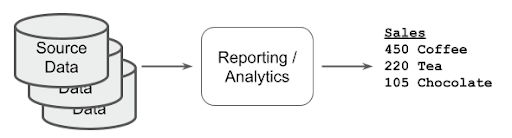
Meanwhile the data science team has developed an ML algorithm that recommends which product customers are most likely to buy. The ML model was trained using data that was feature engineered from the same sources.
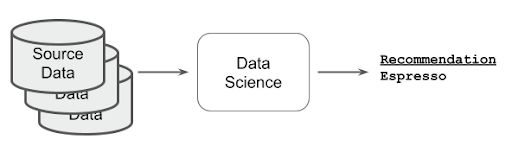
The disagreement may seem trivial. Obviously “coffee” and “espresso” are the same drink, right? Well you might dispute that. In any case, without human intervention, a machine would certainly regard them as two different things.
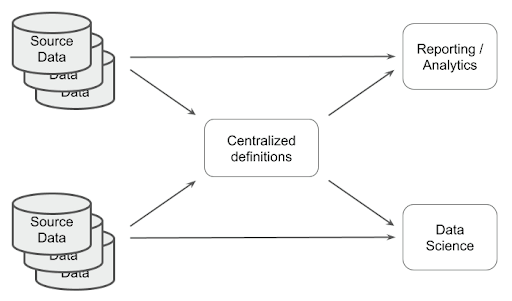
How did this happen? The two data teams went ahead independently and did their work using the same source data, but with their own definitions of “product”. As a consequence:
- Going live like this means customer-facing staff might not actually be able to sell the product that has been recommended. There will be no good way to measure the effectiveness of the machine learning (ML) recommendation engine.
- Whenever the menu changes, both teams will have to redo their work. The reporting team must adjust their transformed output groupings; the data science team must tweak the feature engineering and re-train their model. This is wasteful duplication.
As the number of source systems increases, this kind of situation becomes more likely. As I described in the previous section, in a typically process-oriented development methodology, the data teams have to resort to educated guesswork regarding the actual data values.
Problems like these result in small but cumulative drag working against the efficient generation of insights. This is not a healthy data culture.
It would be better to have some agreement across teams on centralized definitions of the concepts which are core across the business. It’s also better if the task of adapting all the diverse incoming data into the centralized definitions is only done once. These are features of a unified data science and BI environment.
This article on testing the accuracy of predictions contains a worked example of what it looks and feels like to work in an environment where data science and reporting teams share the same data. This article steps through a data science experiment using data that the reporting/analytics team set up.
“Product” is just one example of an entity that can mean very different things to different people within the same organization. Another common example is the names given to marketing campaigns. Campaign names are often typed by hand into different systems, or are not present at all and must be inferred. Both these are examples of polysemes.
Polysemes and Politics
In data integration, “polysemy” just means that different people within the same organization use the same word to mean different things. It can happen wherever there are entities that are shared across multiple parts of the business.
Of course, different departments can use their own definitions of a word with no problems at all. They can optimize their own work independently as data mesh teams.
But gaining more fundamental insights which involve correlation from department to department requires a more joined up approach. In the context of a data warehouse star schema or “dimensional” model it is known as conformed dimensions. In the context of sharing reference data it is known as master data. In Data Vault modeling it is the “Hub” concept. Entity resolution is often done by a master data management (MDM) system. MDM systems may implement golden records physically or virtually.
Whenever multiple parties have an interest in the same entity, there will be debates about governance and management. This can lead to interdepartmental politics and tribalism.
Going back for a moment to the coffee/espresso example I used in the previous section, the data science team naturally did not want to have to wait for the reporting team to finish their product groupings before starting their ML model work. They wanted to dive in, do the experiments, and go to production without delay. The reporting team also did not want to have to wait for the data science team to finish their recommendation engine before completing their product groupings.
The implementation practicalities are:
- To use conformed dimensions in a star schema, everyone else has to wait for the data in the conformed dimensions to be ready. Depending on your angle of interest, this kind of data point might be known as:
- A “late arriving dimension” – an entry that should be in the dimension, but which has not been located yet
- An “early arriving fact” – a transaction that involves an entity that does not yet exist in the dimension
- To use master data or a golden record, everyone else has to put their work on hold until the data steward or MDM interface is ready
So as part of a good data culture, first it must be quick and easy for the data team to manage and use polysemes among themselves. Second, stakeholders must be able to gain clear and quick business advantage from their interactions with all the different data teams.
Data team to end-users
Reporting and analytics help manage operations and make decisions. Data science helps uncover patterns and enables automation. So, after understanding all the source data, and agreeing among themselves how to work efficiently, data teams have to focus on delivering things that are valuable to analysts and the business.
Discovering exactly what those valuable things are can be tricky!
For reporting and analytics teams, it is counterproductive to insist that end users state all of their requirements up front. Attempts to do this always result in a kind of arms race. The end users feel they have only one opportunity, and so they list absolutely everything they can think of. The shocked data team makes a very high cost estimate. In response to that, a deluge of prioritization, risk analysis, and project planning becomes necessary. Design compromises and technical debt creep in.
Data science teams face a similar difficulty. It is impossible to state all the rules up front, because part of their job is to find the rules. Also, a perfectly valid and valuable output might be that there is no pattern, no correlation, and no rule.
So rather than trying to capture all requirements up front, it is more productive overall to focus on small increments. This helps create an aligned data-driven culture with minimum friction over information boundaries. The result is the quickest and most sustainable business value.
Focusing on small increments provides the guarantee that the data team is always working on the top priority at any given time. It also crucially allows the flexibility to quickly reprioritize tasks whenever:
- The business changes, especially when new time-sensitive opportunities arise
- Source systems change, or their business rules are modified. The exchange of semi-structured data is a common way for schema drift to occur
- An output from the data team sparks a new question
All the things in the list above should be happening often! Changes to source systems imply that the business is adapting to new opportunities. Whenever data products are quickly prompting new questions, it is a very good sign that they are hitting the mark.
In other words, as soon as the data team has a functioning solution, the ground changes and rework is needed. So the ability to rapidly iterate all the activities performed by the data team is a key enabler for scalable analytics. This will be the subject of the next article.

Ian Funnell
Data Alchemist
Ian Funnell, Data Alchemist at Matillion, curates The Data Geek weekly newsletter and manages the Matillion Exchange.
Featured Resources
Mastering Git at Matillion. Exploring Common Branching Strategies
Git-Flow is a robust branching model designed to streamline the development workflow. This strategy revolves around two main ...
BlogMatillions Diversity, Equity, Inclusion and Belonging (DEIB) Work and Why It's Important
At Matillion, our primary focus is on cultivating a company ...
BlogThe Importance of Reverse ETL in the Enterprise
Reverse ETL involves moving data from data warehouses or lakes back to operational systems. This blog explains why it is ...
Share: