- Blog
- 11.03.2020
Creating Date Dimensions with Matillion ETL

You may have stumbled across this article looking for help creating or modifying an existing date/time/calendar dimension. Or you may be struggling with dates in your reports or analytical tools. Everyone needs to set up a date dimension. This article will help you understand how to easily create a date dimension within Matillion ETL. For the sake of this article, I will be referring to the date dimension as a calendar dimension to avoid confusion.
Why use Matillion ETL to create dimension tables?
Matillion ETL enables you to migrate and load data into a cloud data warehouse such as Amazon Redshift, Google BigQuery, Snowflake, or Azure Synapse Analytics. You can then transform that data into a suitable format for analytics. This is all done within your cloud data warehouse (CDW) environment. It is worth mentioning that Matillion ETL instances can run on multiple cloud platforms: Amazon Web Services(AWS), Microsoft Azure and Google Cloud Platform(GCP), but keep in mind that some CDWs are only offered on certain cloud providers. For example, Snowflake runs on AWS, Azure and GCP, however, Amazon Redshift only runs on AWS and Google BigQuery only runs on GCP. As part of that data transformation process, Matillion ETL creates dimension tables that can be used in future Transformation Jobs, which helps guarantee that the data going in for analytics will be transformed, well prepared, and yield optimal results.
What is a dimension?
Before moving onto calendar dimensions, let’s step back a little bit. What is a dimension?
A dimension is a collection of reference information about a measurable event). Dimensionality is a key aspect of data warehousing. You can deliver dimensionality through a combination of “measurements” and the “context” for those measurements. The measurements in this case are called “facts” and the context is “dimensions”.
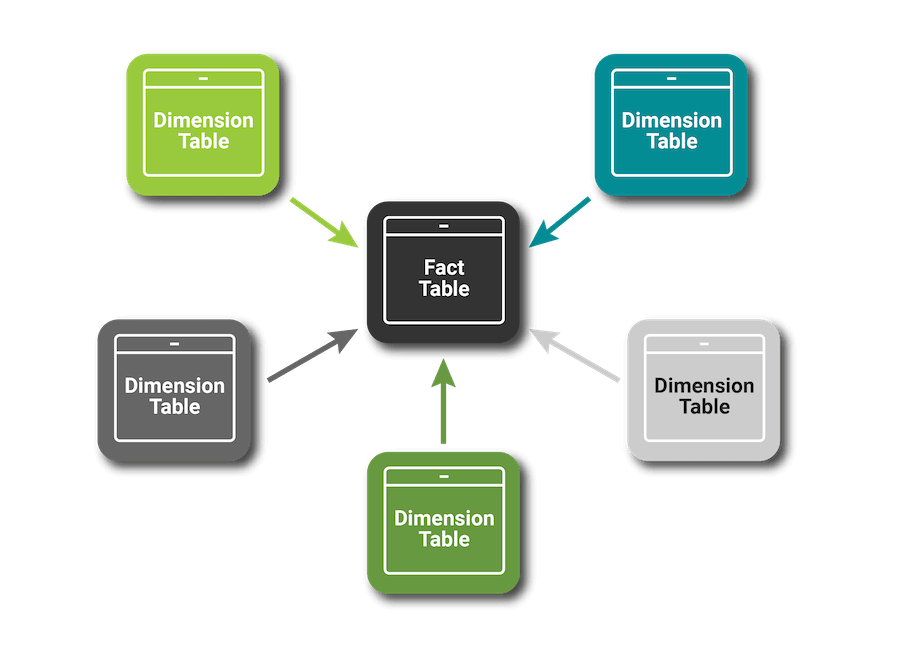
Caption: Fact and dimension tables in a star schema (JavaTPoint (n.d.))
Fact tables and dimension tables
When we use a relational database as the platform for our data warehouse, we store our ‘facts’ in a ‘fact table’. Likewise, we store our dimensions in a dimension table. A dimension table is usually accompanied by a surrogate key. The surrogate key is used to relate data across the tables and is usually generated by the database, which acts both as a primary and a foreign key in fact tables.
The fact and dimension tables have a granularity associated with them. In dimensional modelling, granularity refers to the level of detail stored in a table. For example, a calendar dimension table (with Day, Month and Year hierarchies) has a granularity at the day level (365 rows for a year).
Why create calendar dimensions?
Calendar dimensions are useful in a lot of cases. A calendar dimension contains all of the information about a certain date and allows analysts and users to analyse data as efficiently and accurately as possible (Cludts 2015). This information is then at your disposal eliminating the need to perform unnecessary calculations. Usually a calendar dimension stores historical data, dates that go back to as far as the early 1900s or as far as needed for the facts. But future dates can be used as well. Some common attributes that accompany a date dimension are: isHoliday, DayofWeek, Quarter.
Building a Calendar Dimension
Using a Redshift on AWS instance, I used Matillion ETL to ingest the data by creating an Orchestration Job. An Orchestration Job consists of several components that can retrieve data from other services and load that data into a table. For example, these components can be called Data Stagers, Connectors, or Data Loaders.
(All job files for creating data dimensions are at the end of this blog)
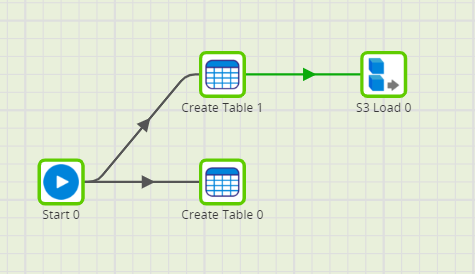
Loading the data
First, I created an empty table that will hold the calendar dimension and a staging table, where the extracted data will sit. To connect to this table, I used an S3 Load component, which extracts the data from a CSV file stored in an S3 bucket and automatically loads it into the staging table.The initial data came from https://www.ukbankholidays.co.uk/year/2000 and I compiled it into a single CSV file that you can download here.
Data Transformation in a calendar dimension
I can now start generating the necessary attributes for our calendar dimension table.
I created a Transformation Job, which will help me generate the necessary columns to shape up the calendar dimension. For ease of future maintenance, we recommend not to hand-code jobs with SQL. Instead, components provide the necessary blocks of code. This is what the full Transformation Job looks like:
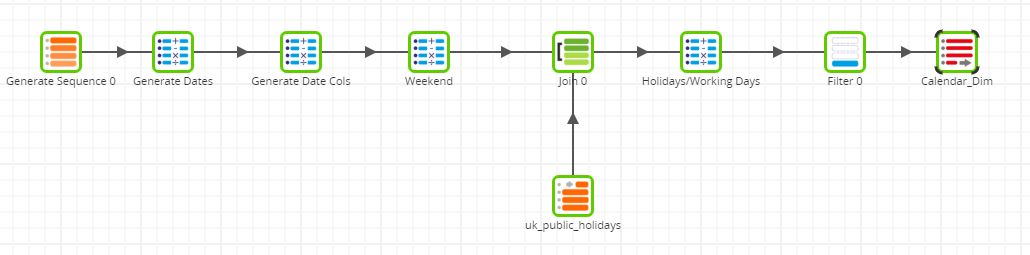
How do each of these components give us what we need? Let’s take a look.
The Generate Sequence Component
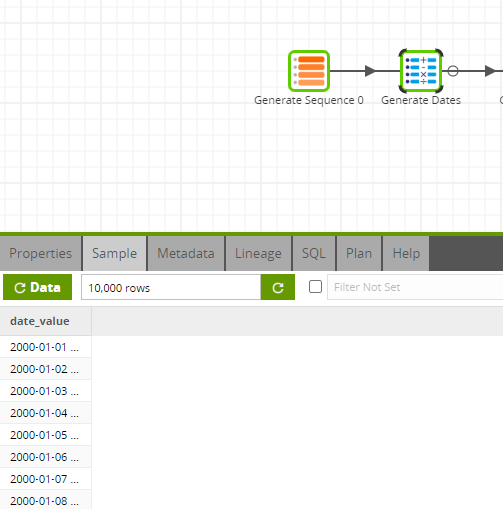
This component in itself simply generates a sequence from 1 to 10000. I then used the sequence generated to generate the dates from 2000-01-01 and onwards. It’s a simple process and saves a lot of time.
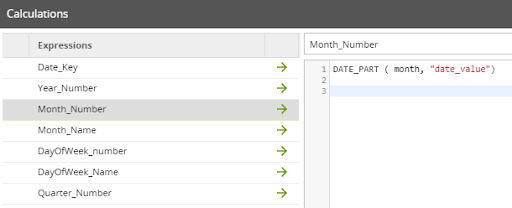
The Calculator Component
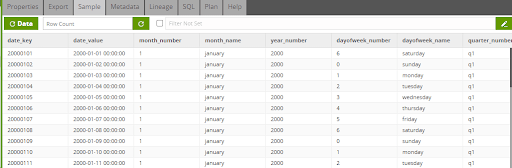
Using the Calculator component, I created columns for the date key, month, year, day of the week and quarter number using the ‘date_value’ that we generated in the previous step. A benefit of the Calculator component is that you do not need to remember both the function names and syntax. All of that information is provided under the functions folder. The functions available will be native to the data warehouse logic.
Now we can check to see if the date falls on a weekend. We do this by using a CASE statement.
CASE
WHEN “dayofweek_number” IN (0,6) THEN 1
ELSE 0
END
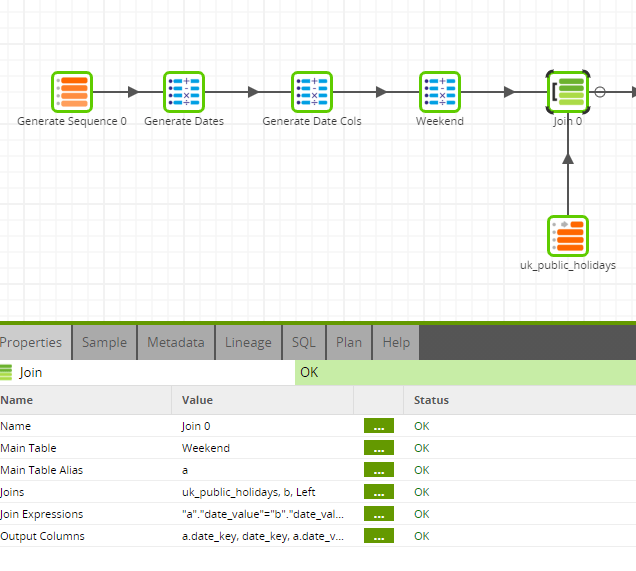
The Join Component
Next, we need to join two data sources (current calendar columns and UK Public Holidays) to aid in generating the two final columns. The Join component joins the columns on a column key. Since the two tables have a matching key (date_value), I used a left join to receive data from the left table, even if there are no matches in the right table. You can also choose between the following join types:
- Inner
- Right
- Full
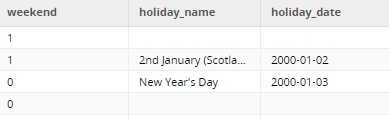
Another Calculator component creates two columns, which will check to see which dates fall on a holiday or a working day, taking into account weekends and public holidays. There is also the matter of two public holidays falling on the same day, creating a few duplicate ‘date_key’ rows. To work around this, assign a sequential integer to each row within the partition of the date_key:
ROW_NUMBER() OVER (PARTITION BY “date_key”)
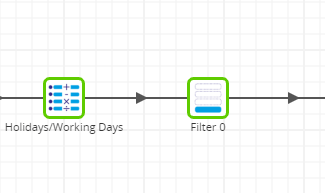
The Filter Component
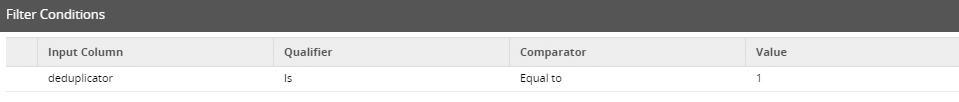
In order to get rid of the duplicates, I created a field that I named ‘deduplicator’ and used a Filter Component to filter out values that are greater than 1. This is done within a simple window, again portraying how easy it is to pull outcomes without the need to hand-code anything.
The Table Output Component
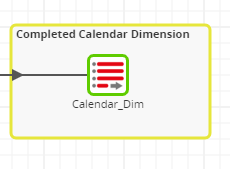
Right at the start we created an empty table in the Orchestration Job. Now, I can use the Table Output Component to push the data into the ‘calendar_dim’ table. In doing so, I will make sure that the Truncate property is set to Truncate, not Append, so that it does not create duplicate rows.
Try it for yourself
Now that we’ve explained how to create a date dimension quickly and efficiently without the need to hand code SQL, try it for yourself by downloading the job file for Matillion ETL for Amazon Redshift. I have also made the job available on Snowflake AWS, Azure Synapse and GCP BigQuery.
You can now start to build out your star schema. We could find further use for this dimension and start linking it to other dimensions to create fact tables. For example in a college scenario, we can use the date key to reference the calendar dimension and use a student key from its respective dimension to build a tuition payment fact table.
To see more ways that Matillion ETL can help you simplify ETL processes and visualize your business logic, request a demo.
Job files for creating calendar dimensions
Matillion ETL for Amazon Redshift
Featured Resources
Enabling DataOps With Data Productivity Language
Discover how Matillion leverages Git and the Data Productivity Language (DPL) to enable seamless implementation of DataOps ...
BlogCustom Connector for Public Statistics (Police API)
A demonstration of the practical steps for setting up components, manipulating and validating data, creating and scheduling ...
BlogMastering Git At Matillion. An In-Depth Guide To Merging
Merging in Git is the process of integrating changes from one branch into another. Merging is the backbone of collaboration in ...
Share: