- Blog
- 06.09.2022
Matillion ETL Job Performance Analysis and Tuning

It is common to build large, sophisticated Matillion ETL Orchestration Jobs that perform a lot of work. One example might be a “Daily ETL” job that launches many other jobs during a batch window.
The job performance analysis and tuning presented in this document is aimed at large, single Matillion ETL jobs that contain a lot of components, and that do a lot of data processing. Over time, it is natural for such workloads to take longer and longer to finish, as volumes increase and the data itself evolves.
To tune a Matillion job, start with the Task History Profiler Shared Job to understand which parts took the longest time to run, and how much ran in parallel.
Prerequisites
The prerequisites for Matillion ETL Job Performance Analysis and Tuning are:
- Access to Matillion ETL
- Access to the Matillion Exchange to download the Task History Profiler Shared Job
- A Matillion ETL user with API privilege
- A Matillion ETL job that has finished running, and that appears in the Task History
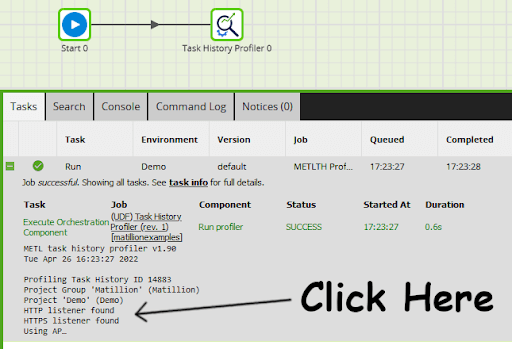
From the Matillion ETL user interface, follow Project/Task History to obtain the Task History ID of the job you intend to analyze. In the example below the highlighted job took 15 minutes 24 seconds to run, which makes it an interesting candidate for analysis. Its ID is 14883.
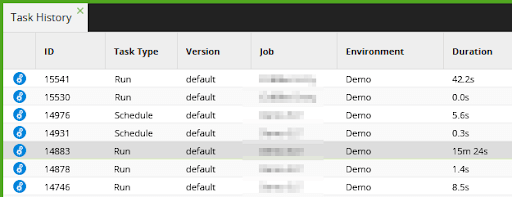
Matillion ETL Task History
Every Matillion ETL Orchestration Job run is made up of Tasks.
- Some Tasks just launch other Tasks. These are known as Parent Tasks, and are colored orange in the representation below.
- Some Tasks perform work themselves. These are the components that can be tuned. They are known as Child Tasks (or Leaf Tasks, or “Threads”), and are colored light blue.
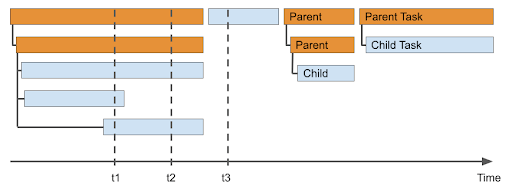
The amount of parallelism is the number of Child Tasks that were running simultaneously at a point in time.
- At t1, three Child Tasks were running in parallel – a thread count of three
- At t2, there were two Child Tasks running in parallel
- At t3, there was only one
The Task History Profiler Shared Job shows:
- How much parallelism was obtained, sampled at regular intervals
- Which Child Tasks took the longest time to complete
How to use the Task History Profiler Shared Job
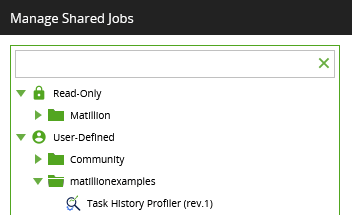
Start at the Matillion Exchange to download and install the Task History Profiler Shared Job. Afterwards you should see it listed under Project > Manage Shared Jobs.
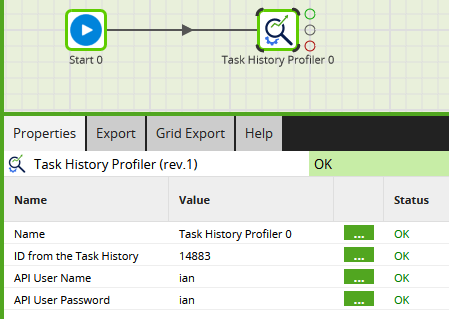
To use the Task History Profiler Shared Job, drag it onto the canvas of a newly created Orchestration Job, and complete the properties.
- ID from the Task History – set to the value you chose from the Task History, for example 14883
- API User Name – your Matillion ETL user, which must have API privilege
- API User Password – the password for that user
To do the performance analysis, just run the job. After it has finished, click the text in the Tasks panel to view the full output.
The Task History Profiler writes a text report. It includes:
- Date, time and version
- The Task History ID being profiled
- The REST API endpoint used to get the Task History
- The current vCPU count of your Matillion ETL instance
- Total elapsed time of the job being profiled
- Parallelism analysis (see below)
- Task and Component analysis (see below)
Interpreting the parallelism analysis
Parallelism is the count of how many Child Tasks were running simultaneously.
- Jobs that ran for over 10 seconds are sampled once per second – every 1000 ms
- Jobs that ran for less than that are sampled every 100 ms
A job that ran for 15 minutes 24 seconds will be profiled (15 x 60) + 24 times, plus once at time zero – 925 points in total.
The parallelism analysis report is a histogram showing how many times each degree of parallelism between 0 and 16 was found. Values greater than 16 are recorded in the bucket of 16.
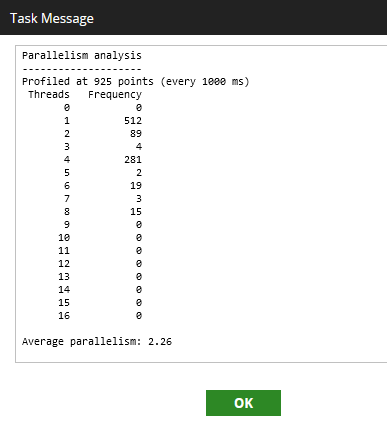
In the example above, at most of the sampling points, either one or four Child Tasks were running simultaneously. The average parallelism is calculated at 2.26.
 To tune a job and reduce the overall elapsed time, try to increase the average parallelism
Consider making the following changes:
- Run Orchestration Tasks in parallel rather than serially
- Use concurrent mode iteration
- Within an iterator, try to give each loop a similar amount of work
- Avoid database transactions (the Begin, Commit, and Rollback components) as they can reduce parallelism
- Use Multiple Environment Connections‘
Interpreting the Task and Component Analysis
Most large, sophisticated Matillion ETL Orchestration Jobs follow the 80/20 rule: 80 percent of the execution time comes from 20 percent of the components.
The Task and Component Analysis shows:
- Counts of the Tasks, Leaf (Child) Tasks, and Components
- The total runtime, which will be longer than the job’s elapsed time if tasks were running in parallel
- The total percentage of time spent on validation
- The list of longest running Child Tasks, in descending order of total runtime. Every item in this list shows the total number of times executed, and the Job Name/Component Name
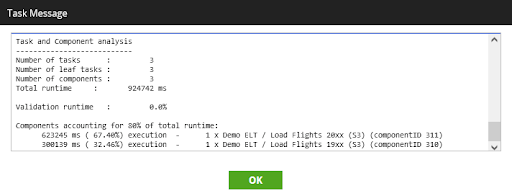
In the example above, the longest running component – accounting for 67.4 percent of the total – was the “Load Flights 20xx (S3)” component in the “Demo ELT” job, and the component was executed just once. This is the component to try and tune first.
To tune a job and reduce the overall elapsed time, look first at the longest running components
To make components run more quickly, consider the following changes:
- Data transformation and loading Tasks can usually be run faster by scaling up your cloud data warehouse or lakehouse
- Transformation Jobs run against your cloud data warehouse, and therefore are already running in parallel. It is usually much more efficient to:
- Run a Transformation Job once and have it process 100 records, rather than run it 100 times processing one record each time
- Load 100 files with just one component execution, rather than run it 100 times loading one file each time
- Elapsed times are totaled whenever the same component runs multiple times. If you have a library function that is executed a large number of times, a small performance enhancement can result in a big time saving
- If you see a significant percentage of validation runtime, consider reducing the number of components in those Transformation Jobs. For example, it is more efficient to use one Filter component with two conditions, rather than two Filter components with one condition each
- For extract and load components such as the Database Query, use the Data Stagers support guide to look for potential bottlenecks. For example, you may try setting the Compression Type to ‘None’ in the Load Options
- Avoid updates and deletes if possible, since these are more expensive than insert operations
Next Steps
Happy performance tuning!
Read the guide to Developing Workflows in Matillion ETL for tips on how to structure your jobs.
It is best to tune jobs that finished successfully and fully. However, you can still look at a job that failed, or a job that was deliberately run partially, to analyze the parts that did run.
Featured Resources
What Are Feature Flags?
Feature flags are a software development tool that has the capability to control the visibility of any particular feature. ...
BlogHow Your Data Teams Can Do More With Marketing Analytics
Improve your marketing analytics with Matillion Data Productivity Cloud that enables businesses to centralize and integrate ...
BlogThe Importance of Data Classification in Cloud Security
Data classification enables the targeted protection and management of sensitive information. Personally Identifiable ...
Share: