- Blog
- 03.11.2024
- Data Fundamentals
Creating Product Led Growth Metrics in Salesforce with AI-driven Web Analytics

Product usage data is crucial for Go-to-Market (GTM) teams to know how leads interact with our products and resources (including websites, blogs, documentation etc). To be clear, this is purely metadata collected from telemetry and web analytics of user behavior.
However, web analytics is convoluted. You can track many different things using tools like Heap, and this list of events keeps growing at a fast rate. Once a set of events has been selected, it is then hard for GTM to compare the influence of every event between leads to determine which lead is more ready for a conversation.
This is the story of how we at Matillion use our own platform to create AI-enhanced data pipelines that generate product-led growth metrics.
Product Qualified Lead (PQL) measurement and architecture
Our goal is to extract the web event data from Heap and develop a PQL score that summarizes the main events in a concise format. To make this information actionable, we want to copy it into Salesforce via a reverse (Extract, Transform, Load) ETL process immediately.
These PQL scores will enable our GTM teams to prioritize leads while also giving them a quick peek at the main events that have affected this score - summarized using a Large Language Model (LLM). Highlighting the main events allows the team to know which events to dig deeper into if needed.
Web Analytics Insight: Streamlining Data Processing from Heap to Snowflake
We start by extracting the relevant data from Heap. Our Heap data already syncs directly to our Snowflake environment, so we only need to use one event table and join it to the user table. Using a calculator component, we can then flag all the relevant events for our score.
We follow this with an aggregate component to get the maximum amount of times a user has performed each event. Finally, we can use another calculator component to develop the actual score. This score is calculated using the maximum we got from the previous step and some event-specific weights that we stored in some pipeline variables.
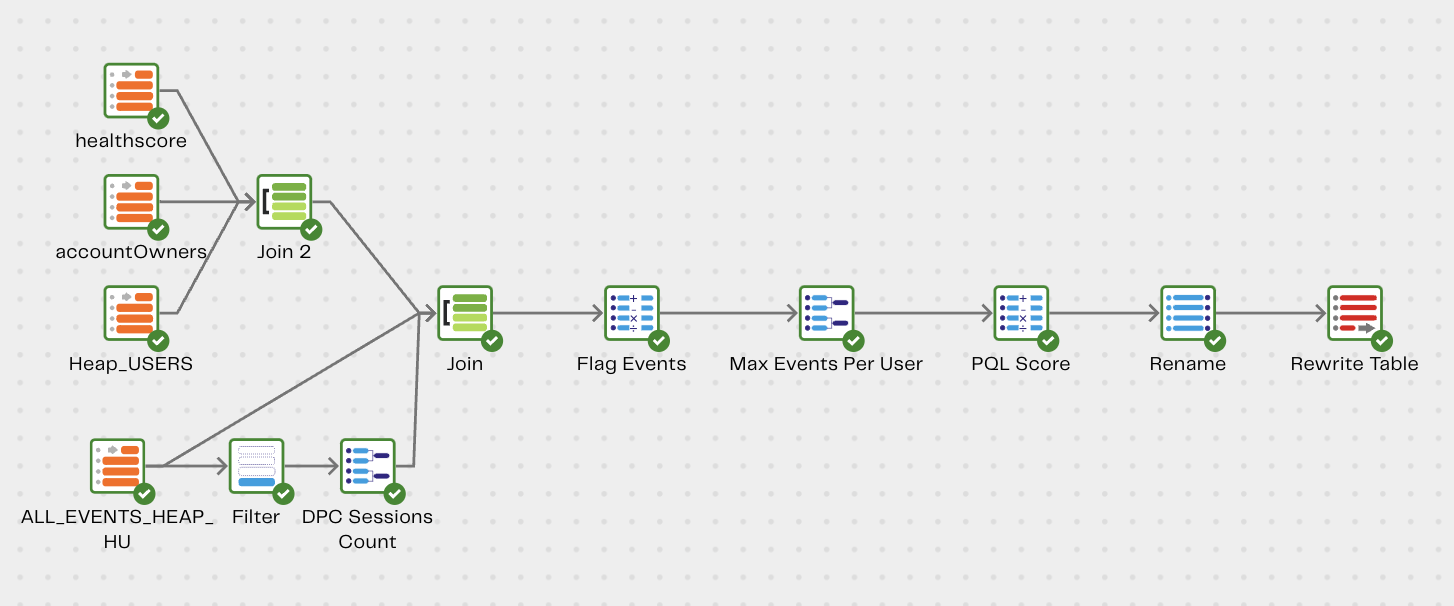
Heap data transformation and analysis
AI Augmented Web Analytics
In addition to calculating a numeric score, we use a large language model to read and summarize lists of the raw events themselves into something more comprehensible.
To make this somewhat unusually readable by the LLM, we start by aggregating data into a single text field. We take the most recent events for each lead, concatenate a timestamp to each, and use a list aggregate to bring them together. This gives us a single text field against each lead for the LLM to read - as shown in the screenshot below. Once again, it's important to note that what we send to the LLM is solely metadata collected based on telemetry and web analytics events. Obviously, no personally identifying information (PII) or customer data is sent!

Aggregating web event data in preparation for LLM processing
The aggregated log of events - shown below - is fairly impenetrable to a human reader but is quite consumable by a large language model.

Aggregated log of events - data sample
We use our Azure OpenAI Prompt component to ask an Azure GPT4 model for a summary. Configuring this is as simple as selecting the model, endpoint, and API key and then entering the question we want to ask.
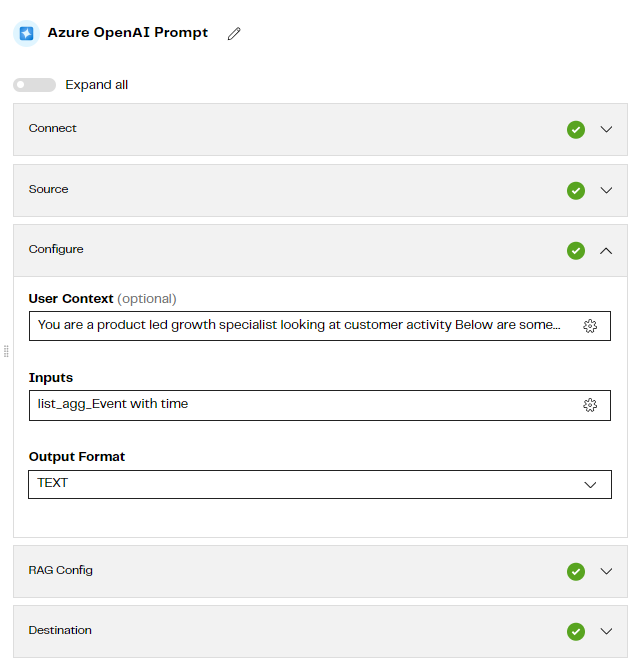
The Matillion Azure OpenAI Prompt
The exact question in the user context box here was -
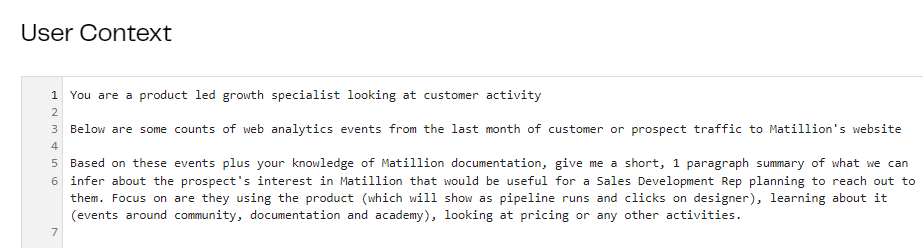
For the example above, this produces a rather lengthy response:
“Analyzing the provided web analytics events for Matillion's website, it appears that the prospect has demonstrated a significant interest in the practical use of the Matillion product. The events indicate that the prospect has engaged in multiple sessions involving the creation of transformation pipelines and has interacted with the designer interface, as evidenced by clicks on the 'run pipeline' button, interactions with the Git features, and usage of the component properties within the designer. This suggests that the prospect is not only exploring the capabilities of the Data Productivity Cloud (DPC) but is actively testing and utilizing the tool to understand its functionality, which may include version control and pipeline execution. There are no direct indications of the prospect exploring community resources, documentation, or the Matillion Academy, nor are there events related to pricing page views. This level of engagement with the product's core features indicates a readiness to potentially move forward in the customer journey, and a Sales Development Rep (SDR) could use this information to tailor their outreach with a focus on how Matillion can further meet the prospect's data transformation and pipeline management needs, possibly leveraging the prospect's hands-on experience with the product to discuss more advanced features or use cases.”
Fortunately, we can simply put this back into a second Azure OpenAI Prompt component, this time with the instructions -
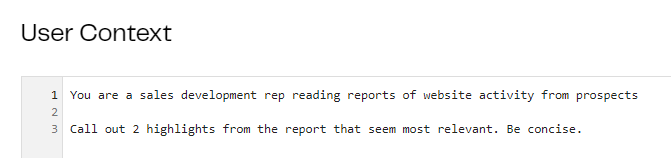
That gets us a far more concise output:
“1. The prospect has been actively engaging with the Matillion product by creating transformation pipelines and using the designer interface, indicating a deep interest in the tool's core functionalities.
2. The prospect has interacted with advanced features such as the 'run pipeline' button, Git integration, and component properties, suggesting they are testing the product's capabilities and may be ready for discussions on more sophisticated uses.”
That’s much more suited to go as a text summary alongside the PQL score, giving a clear view of why they are a strong prospect and a starting point to frame an outreach conversation with them.
Reverse ETL into Salesforce
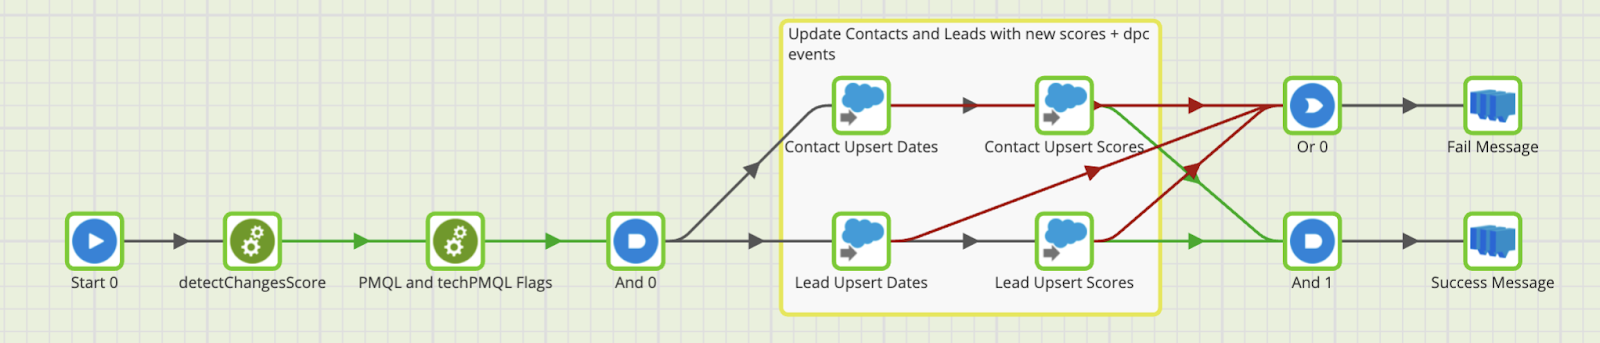
Once we have written these scores and summaries out to a new table, we can compare it to what already exists in Salesforce using a Detect Changes component. This will help make the upsert more efficient because it will only update the fields that have changed in the last 24 hours. We can filter out any fields that are identical (have an I in the Indicator column). Because this score will be updated for the Contact and Lead objects in Salesforce, we need to store them in separate tables.

With the new table of PQL score changes, we can now upsert them into Salesforce using two Salesforce Output components. Each component will look at the tables we created in the previous step and replace the current PQL score with the compare_PQLScore value for every Contact/Lead ID. We have a final step to send an alert if the pipeline has run successfully or failed.
In Summary
This article has demonstrated how to tackle some of the classic web analytics data engineering challenges: transforming data for analysis and automating AI-enhanced workflows.
It's easy to try out Matillion yourself: sign up for a free trial and begin your web analytics journey!
About the authors
Julian Wiffen
Director of Data Science
Julian Wiffen, Director of Data Science for the Product team at Matillion, leads a dynamic team focused on leveraging machine learning to improve products and workflows. Collaborating with the CTO's office, they explore the potential of the latest breakthroughs in generative AI to transform data engineering and how Matillion can play a pivotal role in supporting the needs of those working with these cutting-edge AI models.
Susana Cardoso
Data Engineer
Susana Cardoso is a Data Engineer for the Data Science team at Matillion. As a data engineer, Susana harnesses the Matillion products to unlock valuable data insights across different areas in the business. Apart from analyzing and transforming data, Susana also ventures into the innovative world of AI and ML.
Featured Resources
What Are Feature Flags?
Feature flags are a software development tool that has the capability to control the visibility of any particular feature. ...
BlogHow Your Data Teams Can Do More With Marketing Analytics
Improve your marketing analytics with Matillion Data Productivity Cloud that enables businesses to centralize and integrate ...
BlogThe Importance of Data Classification in Cloud Security
Data classification enables the targeted protection and management of sensitive information. Personally Identifiable ...
Share: